Despite having written a Spotfire blog for over 3 years, there are still a handful of Spotfire features and functions I haven’t written about. Bookmark special fell into this category, and I knocked it out a few weeks ago. This week, I am discussing using relations and column matches, so you can learn how to work with data in separate tables. These are great Spotfire functions, and users often confuse them or don’t understand when to use one versus the other. It’s time to clear that up.
Originally, I wrote this up as one post, but it got too large. Therefore, I’ll break the content into 3 weekly posts as shown below.
- What are Relations and Column Matches?
- Using Relations in Spotfire
- Using Column Matches in Spotfire
This week’s post introduces these two functions. The next 2 weeks will dive into the details of each one with plenty of examples. So, let’s talk about the difference between relations and column matches.
What Are Relations & Column Matches?
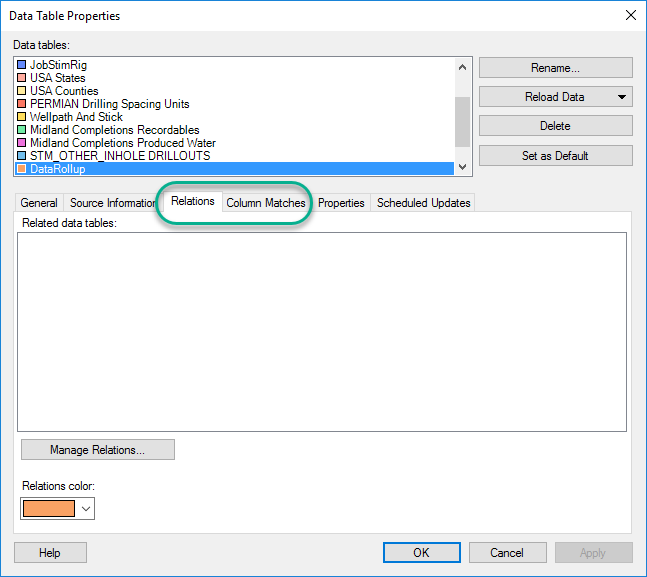
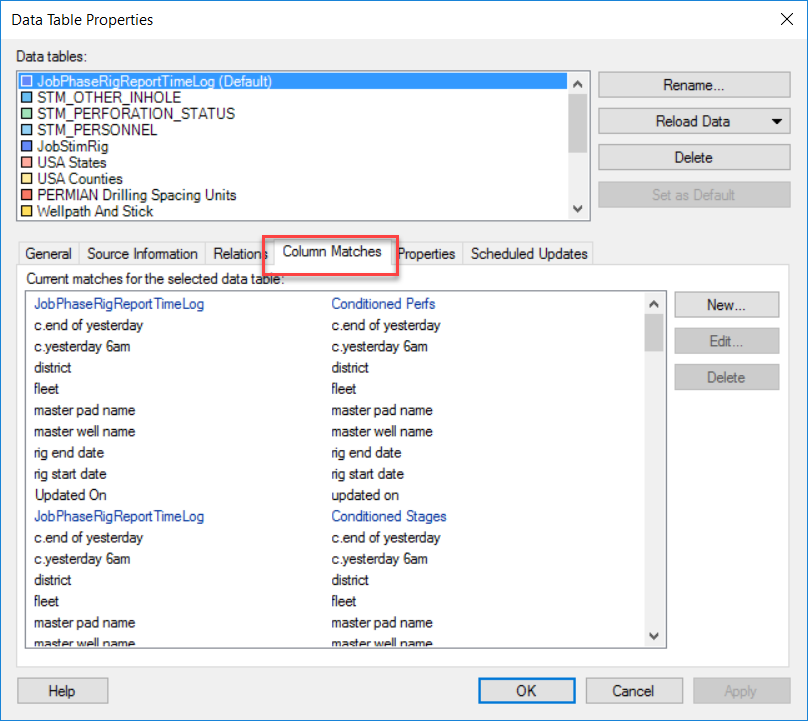
Generally speaking, users apply relations and column matches so they can better work with data when it is in separate tables, rather than a single table. Users set them up in Data Table Properties, as shown below.

Relations
Relations facilitate integrated filtering and marking across tables. In other words, if a user filters down to specific wells in a table, the filtering also occurs in any related tables. This is a very handy feature to have. Without it, users would have to filter in multiple tables, which is just annoying really. The short video below shows an example of integrated filtering in a Lending Club data set of loans given to consumers.
Relations also integrate marking. If you mark data in a visualization connected to one table, visualizations connected to related tables are also marked. The video below shows an example of integrated marking.
Column Matches
Column matches perform a similar, but different, function. They allow the user to put data from different tables on one visualization. This is very handy if your data lives in separate tables and you don’t want to or can’t combine the data into a single table.
A key difference between column matches and relations is that Spotfire will create column matches for you based on the column name and data type. Whereas, the user must create all relations. There is a good reason for this that I will explain in the next posts.

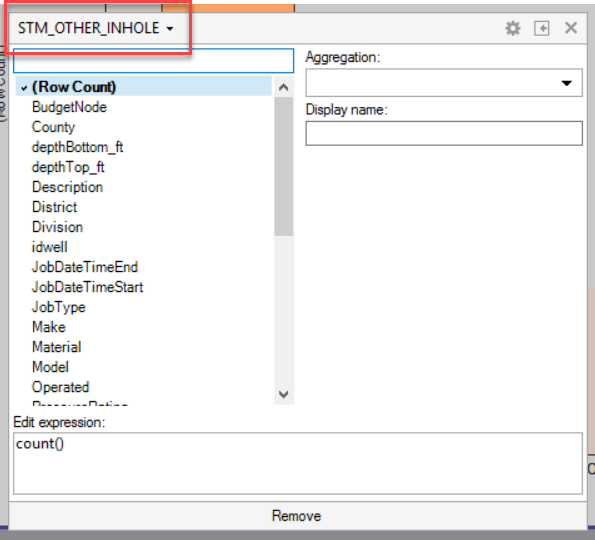
Column matches are also how you can create calculations between or across tables. With a column match, the user may write an expression on the y-axis of a visualization and calculate across tables. When a column match is present, the user will see a drop-down of matched tables as shown below.

Wrap Up
Now, this is just a general introduction to column matches and relations. Stay tuned next week and the following week for detailed posts with examples.
Spotfire Version
Content created with Spotfire version 10.2

Pingback: Rearrange Visualizations Using Bookmarks » The Analytics Corner
Pingback: How to Use Relations in Spotfire » The Analytics Corner