Skip to content

Spotfire

How to Learn the Spotfire Expression Language

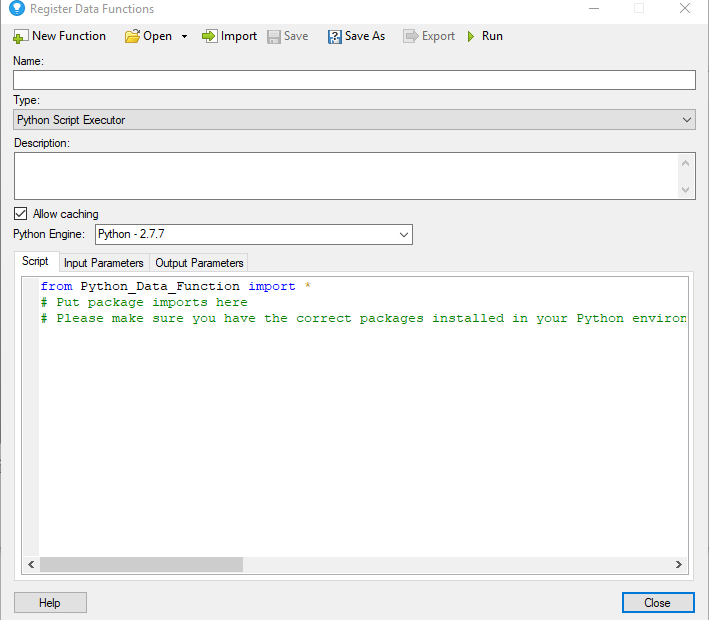
Since launching the Analytics Corner, I’ve focused heavily on IronPython with a dash of Alteryx. I’ve started working more with Axis Names recently, which was a reminder of how nonintuitive they are. Because I haven’t written much on Spotfire expressions since starting the Analytics Corner, I’m going to do a comprehensive series on how to learn the Spotfire expression language, which will include a good section on Axis Names.

Today’s first post will be a short summary of the different ways to write expressions in Spotfire. Next week, I’ll talk about the over keyword. Then, I’ll cover node navigation, which might take more than one post. I will also show you how to use important functions like $esc and $map. Finally, I’ll close out with a few posts on Axis Names. Read on to get started.

Read More »How to Learn the Spotfire Expression Language
Creating Dynamic Display Names for Spotfire Visualizations

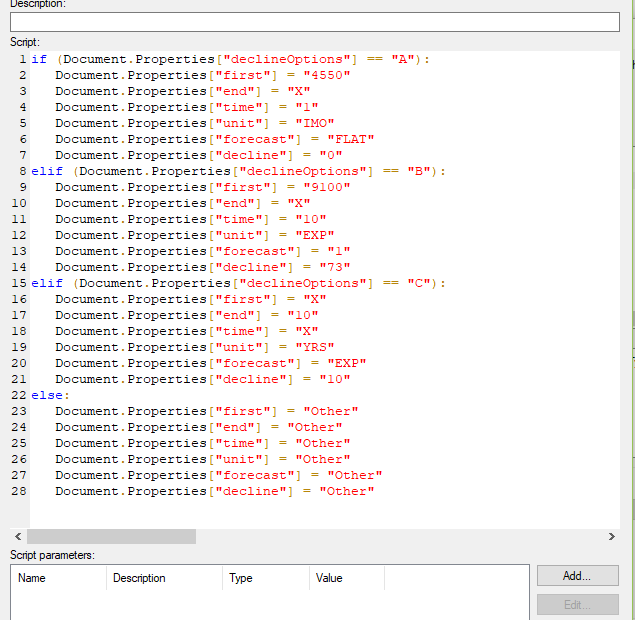
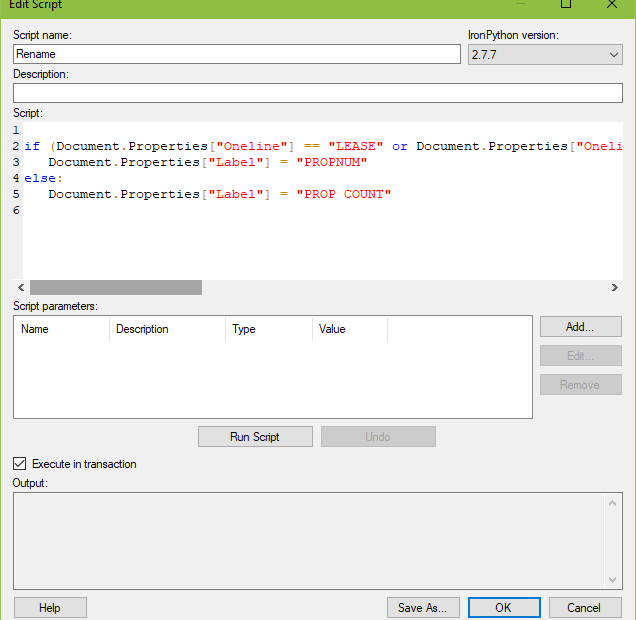
A coworker reached out to me for help on a visualization. He was using a drop-down property control to set the value of a bar chart x-axis. If he chooses option 1 or option 2, the display name should be a certain value. If he chooses option 3 or option 4, a different value should appear. I’ve definitely had this come up before when using dropdown property controls. There is an IronPython solution for creating dynamic display names. Let me show you.

Read More »Creating Dynamic Display Names for Spotfire Visualizations

Error Reporting with Alteryx & Spotfire

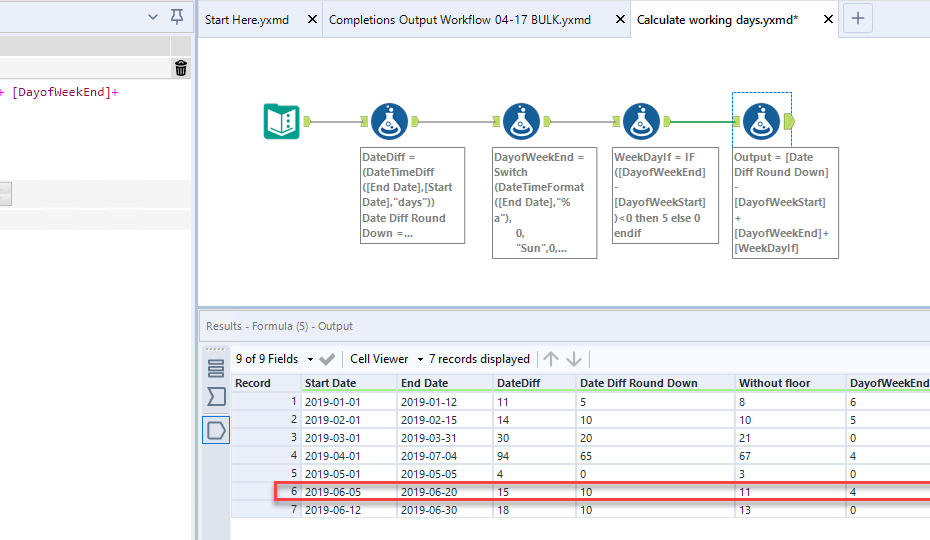
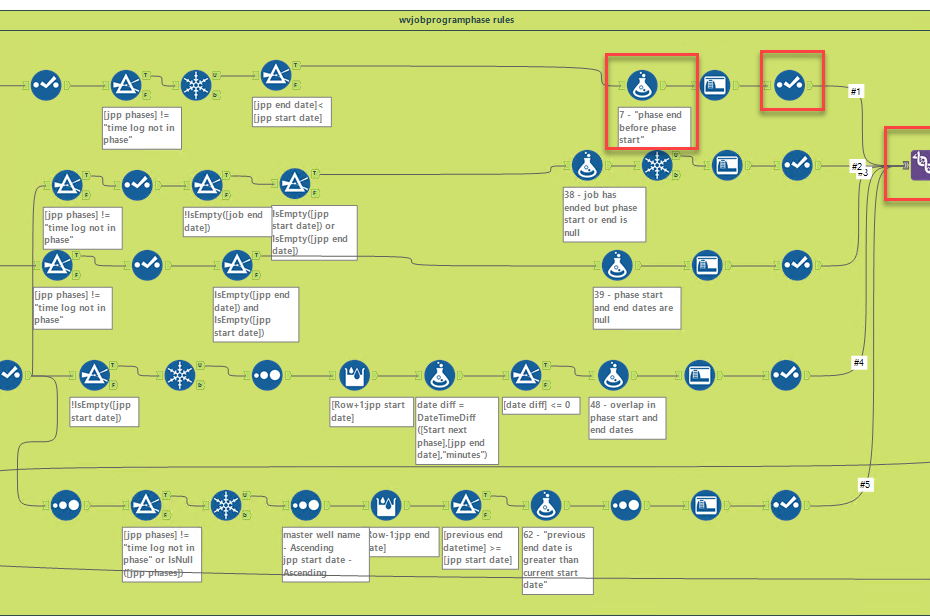
It’s a fact. If you have manual data entry, there will be errors. I found this out the hard way when working with our completions team on a Spotfire KPI project. We built the Spotfire KPIs and were attempting to tie out to spreadsheets. The numbers didn’t match. Discrepancies consistently traced back to bad data entry. We would fix the bad data, but without proper controls to keep it out, we were chasing our tails. So, we addressed bad data with a QAQC or error report. The first version was all Spotfire, but it had flaws. Version 2 performed error reporting with Alteryx. Ultimately, I wound up with a combination of Alteryx and Spotfire. To see what it looks like and how it was implemented, read on.

Read More »Error Reporting with Alteryx & Spotfire

How To Make Type Curve Inputs More Efficient

Type Curve generators are standard in reservoir engineering workflows. They are also a bit problematic. They require lots of inputs, which are time-consuming to build and fill out. You can’t easily recreate them in other projects. Therefore, my next two posts will show you how to make type curve inputs more efficient. The first post will demonstrate how to populate type curve inputs with IronPython and toggle between different sets of inputs. The second post will go further by allowing users to load type curve settings in a table. Then, the user tells an R function which row to pull from the table and place in the type curve inputs. Read on for these great solutions!

Read More »How To Make Type Curve Inputs More Efficient

How to Add Video to Spotfire Text Areas

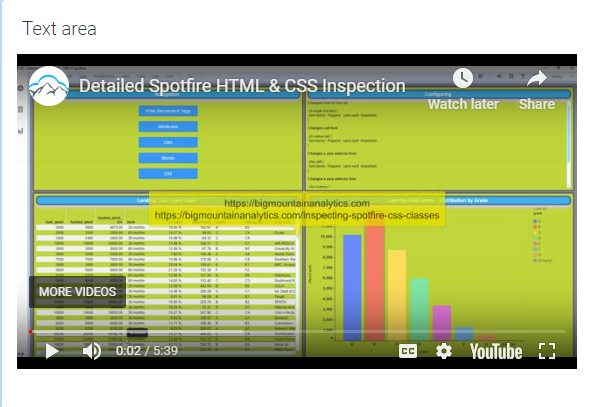
The Spotfire projects I build just keep getting bigger and bigger. As they get bigger and more complex, it’s helpful to provide detailed instruction to users. One of the easiest ways to do that is with video. One of my coworkers recently showed me how he used basic HTML to embed a video tutorial for the analysis into a text area. Now, users don’t have to search for it. It’s right there in the DXP. This post will show you how to add a video to Spotfire text areas.

Read on to learn how.

Read More »How to Add Video to Spotfire Text Areas