Skip to content

Visualizations

Why Do Counts Aggregate Differently in Spotfire?

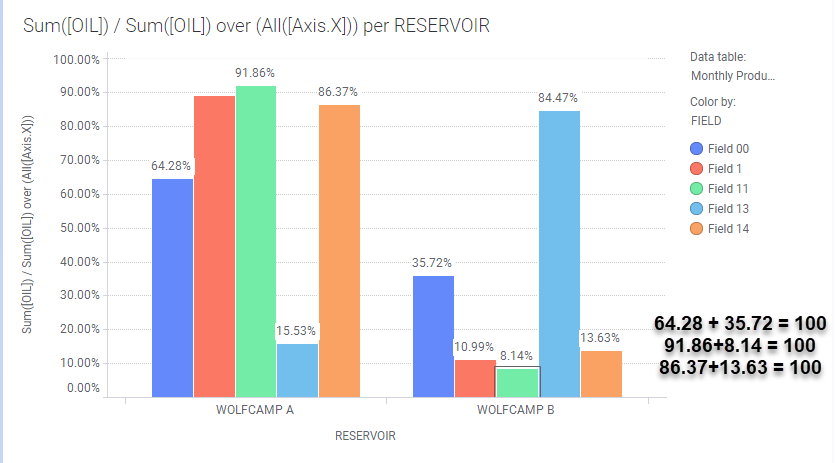
Last week, I wrote a post on using Axis Names on Cross Tables. My examples calculated the difference in Amounts between two scenarios on a cross table. I also needed to know the difference in well counts between scenarios, this time on a bar chart. But, when I changed the aggregation from a Sum to a CountDistinct, the calculations didn’t work anymore. That is because counts aggregate differently than the other aggregation methods. Read on if you want to get your counts right!

Read More »Why Do Counts Aggregate Differently in Spotfire?

Data Limiting with Expression versus Show Hide

A few weeks ago, I wrote a post on data limiting in Spotfire when column names change. I provided solutions using both data limiting with expression and the Show Hide Items function. I struggled to get working solutions in both because I expected them to work the same way, but they do not. Therefore, this week, I developed a comprehensive tutorial to show you what they can do and how they are different. Read on to learn more.

Read More »Data Limiting with Expression versus Show Hide

Use TERR to Dynamically Update Visualization Titles

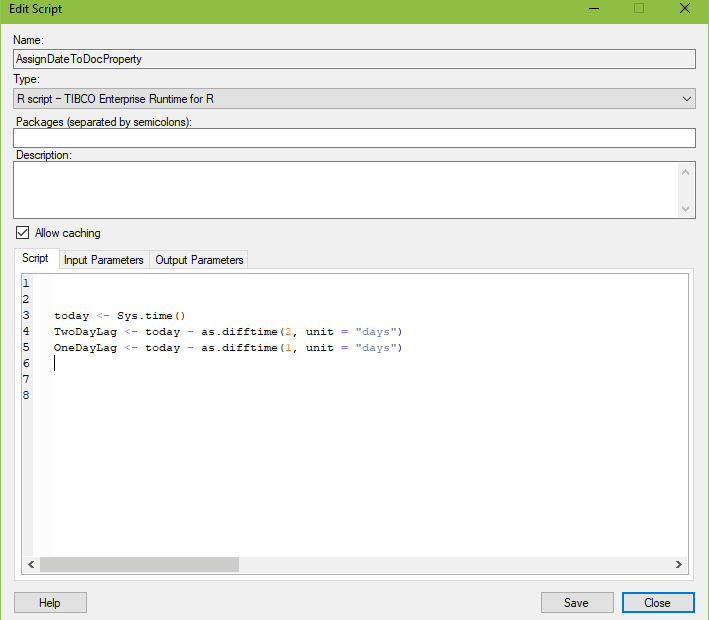
This week, I worked with our production team to create a downtime dashboard. The dashboard only brings in allocated data, which has a two-day lag. It makes sense to include the date of the most recent data in the visualization title. This task can be accomplished with TERR, JavaScript, or Python. I chose TERR for my project, so this post will show you how to use TERR to dynamically update visualization titles.

Read More »Use TERR to Dynamically Update Visualization Titles

Using Document Properties to Control Data Limiting by Expression

I love data limiting with expressions! It is my go-to method for data limiting because it is the most flexible. However, I found myself updating expressions over and over in tons of charts. It was just inefficient and painful. Then, I learned how to connect document properties to my expressions. Now, I know how to be more efficient in my data limiting. I promise this is worth your time! Read on to learn more.

Read More »Using Document Properties to Control Data Limiting by Expression

Spotfire Axis Names on Bar Charts

Last week, I introduced the concept of Axis Names. If I counted correctly, there are 19 axis names applicable to one or more of the 14 visualizations in Spotfire. I will go through the axis names one visualization at a time, beginning with axis names on bar charts. Although, I learned very quickly that just because you can use an axis name on a given visualization, it doesn’t mean you should. I’ll show you what I mean by looking at Axis.X and Axis.Color. Read on to learn more.

Read More »Spotfire Axis Names on Bar Charts

Positioning Labels on Feature Layers in Spotfire Maps

A user reached out to me asking for help with labels on a feature layer in a map chart. At first, I thought he wasn’t seeing the label, which is a common problem. Actually, he needed help positioning labels on feature layers. It used to be the case that you couldn’t move map chart labels, but that has changed. It is now possible to move labels on feature layers, but it’s not as easy as a right-click. Read on to learn the steps.

Read More »Positioning Labels on Feature Layers in Spotfire Maps

Creating Dynamic Display Names for Spotfire Visualizations

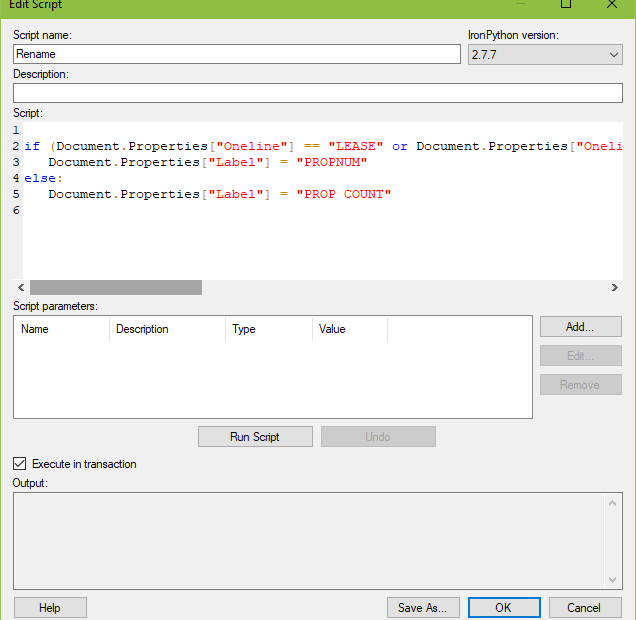
A coworker reached out to me for help on a visualization. He was using a drop-down property control to set the value of a bar chart x-axis. If he chooses option 1 or option 2, the display name should be a certain value. If he chooses option 3 or option 4, a different value should appear. I’ve definitely had this come up before when using dropdown property controls. There is an IronPython solution for creating dynamic display names. Let me show you.

Read More »Creating Dynamic Display Names for Spotfire Visualizations

Add Bar Chart with IronPython

This is my third week working thru IronPython scripts from the Spotfire IronPython quick reference. Last week, we looked at for loops. The week before, we used IP to modify titles. This week, we’ll insert visualizations with IronPython and explore the API as we go. We’ll get started learning how to add a bar chart with IronPython to an analysis.

Read More »Add Bar Chart with IronPython

Change Visualization Titles with IronPython

I promised a return to Spotfire API for IronPython posts, and that is finally happening. I had to get a few drafts cleared out, like 5 Ways to Approach Troubleshooting Data Problems, but now I’m back on track discussing how to change visualization titles with IronPython

In October last year, I committed to spending 100 hours learning IronPython. I wrote several “starter” IronPython posts, which can be found in the Data Shop Talk Archive. I have lost count of how much time I’ve spent on IronPython, but the clock starts again today.

My goals haven’t changed. They are still to ….

  1. Get an understanding of IronPython structure
  2. Develop an understanding of the Spotfire API
  3. Apply that understanding in Spotfire code examples

For the next several weeks, I’ll be using the code snippets posted on The Spotfire IronPython Quick Reference to explore the API. I’ll punctate that with an article here and there are the IronPython/Python structure as I go. Read on for this week’s code snippet.

Read More »Change Visualization Titles with IronPython