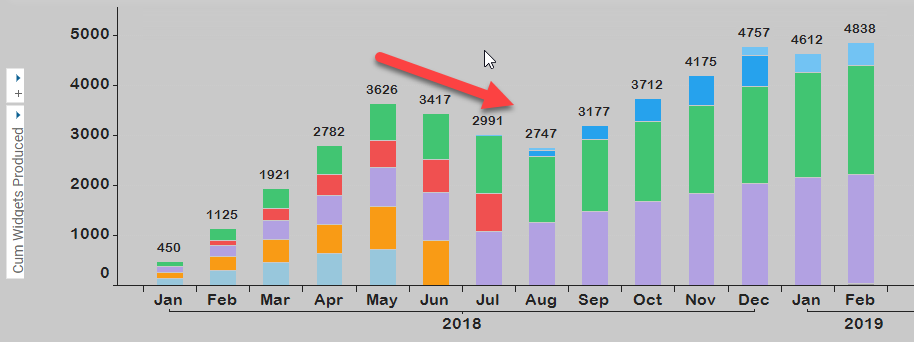
I ran into cumulative sum problems this week. The cumulative sum shown on my bar chart was descending, which is clearly wrong. Read more to find out how this can happen in Spotfire stacked bar charts.
My Project
I am working on a project this week that required cumulative plots. It’s very easy to build cumulative plots in Spotfire using the Cumulative Sum aggregation method on the y-axis or Over and Node Navigation if you are writing a calculated column. In this particular case, I wanted the plot to adjust with filtering, so I used the Cumulative Sum aggregation method on the y-axis.
Cumulative Sum Problem
I was so confident in what I was doing that I just threw this together and moved on to something else. Later on, I was showing the project to a coworker, and they pointed out that my cumulative plot was descending after May. That can’t be right…..the column of data I am using contains a value of 1 or null. The column is adding up 1s. How can it possibly be descending?

Cumulative Sum Solution
The problem is in the Color By. I am using a column to color the bars. After May, the light blue bar doesn’t appear in the data set and thus doesn’t get added up anymore. There is no color in June for the visualization to add to, so it disappears.
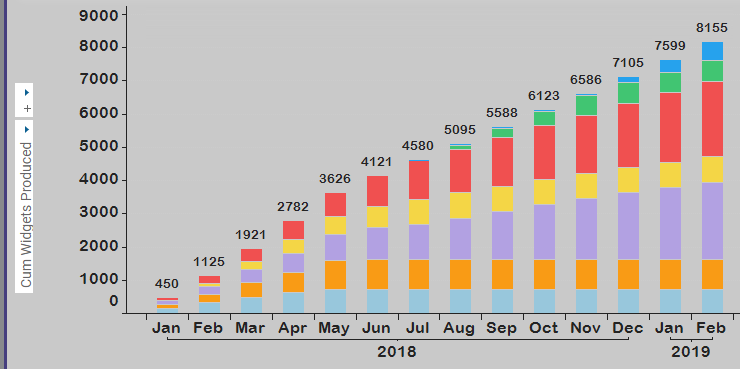
And just so you are clear on the math, the visualization below doesn’t have a Color By variable set. In May, the
Technically, there are three possible solutions to this problem, but one is clearly a better solution.
- Choose a different visualization type
- Remove the Color by variable
- Modify the Appearance properties to compensate for missing values (best solution)

Now, we can see the visualization as intended.

Spotfire Version
Content created with Spotfire 7.12.

Pingback: How to Learn the Spotfire Expression Language » The Analytics Corner