Welcome to part 3 of my Spotfire Data Limiting Series. The first post in the series covered data limiting with filter and data panels. The second post talked about data limiting in the web player. This post will explain how to use filtering schemes to limit data. This is an essential skill for new users to master. For more experienced users, the post will also explain when filtering schemes work best and when to choose another method.
Now, since I’ve never written about filtering schemes before, I’m going to cover what a filtering scheme is and how to use it. Here’s how it’s going to go:
- Filtering scheme basics
- What is a filtering scheme?
- How to create and modify filtering schemes.
- How to limit data with filtering schemes.
- When to use filtering schemes
- When not to use filtering schemes
Let’s get going with the basics.
Filtering Scheme Basics
What is a filtering scheme?
By default, any filtering that happens in the filter panel in Spotfire applies to all pages and all visualizations. However, that’s pretty limiting. Fortunately, Spotfire is more flexible than that, and filtering schemes are a method for limiting data within one or more pages or even one or more visualizations.
Creating and Modifying Filtering Schemes
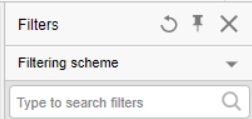
Filtering schemes can be accessed and modified from two locations. The first location is the filter panel. Right-click on the header of the filter panel (on the word Filters) and then select Show Filtering Scheme Menu.

Now, the Filtering Scheme menu is visible in the filter panel.

From this menu, you can apply an existing filter to the current page, create a new filtering scheme, or open the Manage Filtering Schemes menu. The only thing you can’t do from this menu is rename or delete filtering schemes.

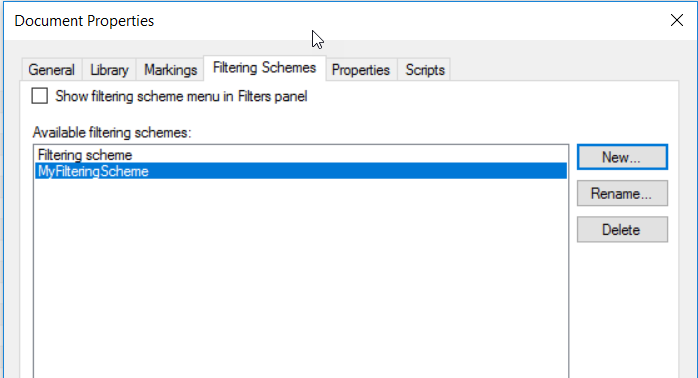
The second place to access filtering schemes is the Manage Filtering Schemes menu. You can get there using the steps described above, or you can go to Edit — Document Properties — Filtering Schemes tab.

From here, you can create, rename, or delete filtering schemes, as well as turn the menu on or off in the filter panel. The only thing you can’t do from this menu is apply a filtering scheme to a specific page or visualization.
Next, I’ll talk about how to use filtering schemes.
Limiting Data with Filtering Schemes
To use a filtering scheme on a page, simply set the filtering scheme in the filter panel and then modify the filters. Any page using that filtering scheme will be updated accordingly. If you are using a filtering scheme in multiple pages, a change made in one page will impact all the other pages using that scheme.

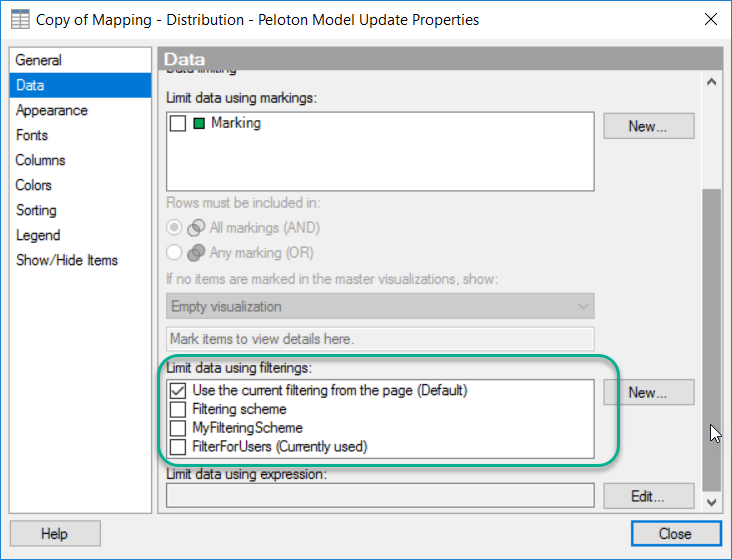
To use a filtering scheme on one or more visualizations, open the visualization properties and go to the Data tab. Scroll down until you see the section entitled Limit data using filterings. Uncheck the option entitled Use the current filtering from the page (Default) and check the box of the filtering scheme you would like to apply to the visualization. It is possible to have more than one filtering scheme applied to a visualization. In my opinion, this gets confusing. I avoid having more than one box checked.

Next, let’s talk about when to use filtering schemes for data limiting.
When to Use Filtering Schemes for Data Limiting
When I first learned to use filtering schemes, I LOVED them. I thought they were the greatest thing ever. However, the more I used them, the less I liked them. I found myself running into the following problems.
- Constantly renaming filtering schemes.
- Creating too many filtering schemes to manage.
- Constantly redoing the filters in a given filter scheme.
- Doing a lot of editing to make sure users had the right controls to not accidentally reset the filtering scheme.
- Expanding and contracting tables REPEATEDLY in the filter panel as part of the organization process.
- Desktop users hitting the Reset All button and breaking the filtering anyway.
- Constantly changing filtering schemes used in individual visualizations.
My ultimate impression of filtering schemes was that they tended to be high maintenance, and when you have a lot of tables in a project, working with the filter panel gets tedious. Thus, I suggest using filtering schemes in the following circumstances.
- Simpler analysis (small number of tables, visualizations, pages, or filters).
- When users know what filtering schemes are and how to use them.
- When the project is being consumed in the web player and filters have been controlled and managed as explained in the web player data limiting post.
- Use them if you can build them out at the end of a project when rework is less likely.
If you do decide to use filtering schemes, I highly suggest documenting them. Write down what was filtered and why. If a filtering scheme accidentally gets reset, it will be a relief to have something to refer back to.
When Not to Use Filtering Schemes for Data Limiting

The biggest problem with using filtering schemes for data limiting is that they can be reset with the Reset All Filters button in the toolbar. Doing a hard reset will probably muck up what you intended. Thus, I do not recommend using filtering schemes in the following circumstances.
- When using the desktop client and users do not know what a filtering scheme is or how to make sure they don’t unintentionally modify it.
- In large projects with a lot of tables and filters where filtering schemes will be harder to manage.
- When requirements are still changing. You want to avoid reworking filtering schemes if possible.
In conclusion, I don’t use filtering schemes much anymore because I tend to work on large projects. My current project has around 36 tables, and I don’t want to use the filter panel at all. Hopefully, you now know when to use filtering schemes and when not to. Next up in the series — Filters in Text Areas.
Spotfire Version
Content created with Spotfire 7.12.

Pingback: Data Limiting In Spotfire • The Analytics Corner
Pingback: Part 4 - Data Limiting with Marking • The Analytics Corner
Pingback: Part 6 - Data Limiting with Subsets • The Analytics Corner
Pingback: Part 7 - Data Limiting with Rules » The Analytics Corner
Pingback: Part 5 - Data Limiting With Expressions » The Analytics Corner
Hi Julie,
Thank you for your article.
Can you please tell me if it is possible to link 2 filtering scheme together?For example, I want to pass column ‘x’ value from ‘fs1’ filtering scheme to same column ‘x’ of ‘fs2’ filtering scheme. Thank you!😊
You can use filtering schemes together, but you can’t pass from one to another.