Opening Keynote
The conference opening keynote was themed “Achieving Clarity in a World of Ambiguity”. Well, that feels familiar. Trying to deliver data and analytics solutions in a timely manner is a challenge. In order to deliver, we often bypass formal channels, build workarounds or one-off solutions. Who hasn’t fallen into the trap of experiment while thinking, “Let’s try this and see if it works.” Years later, that experiment is still in place. This can feel chaotic and unstructured. Let’s not even mention how quickly technology changes. So yes, it’s ambiguous. Fortunately, a big subject of discussion was organizing analytics chaos.
Traditional BI Will Never Scale
After the keynote, I attended a presentation on “The Foundation of Modern Analytics and BI” by Cindi Howson. She explained traditional BI as this…
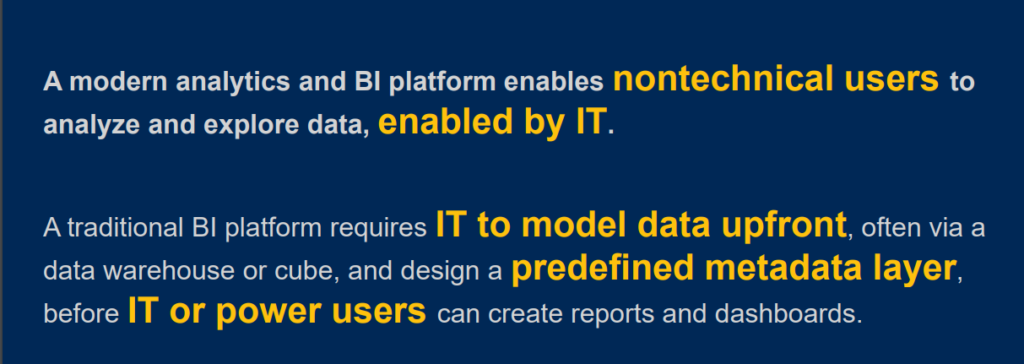
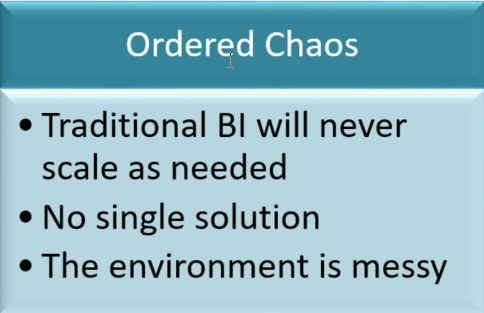
Now, this and subsequent presentations emphasized that no one has made the traditional model work. It’s just a bad model. Companies can rarely afford to scale to the level of traditional BI required to meet business needs. Furthermore, the business finds traditional BI slow and ineffective. By the time IT delivers a solution, the problem that generated the request is no longer a problem. Now, there are new problems. In other words, the traditional model only addresses known data and questions. It doesn’t address unknown or future questions.
Thus, the traditional way of delivering data (along with the waterfall method of development) doesn’t work anymore, if it ever worked at all.
No Single Solution
With that said, there is no single solution to solve all of our analytics and data problems. While this may sound obvious, it is what we’ve always done. I’ve helped implement cubes, data warehouses, ERP systems, and data virtualization tools in an effort to deploy one solution that solved it all. Hint, it didn’t work. Instead, we must accept that there are many solutions.
Hmmm….is that better?
Of course, the idea of implementing more solutions sounds more painful. The solutions mentioned above took serious effort to deploy. Therefore, why would we want to multiply that pain? Well, we must add more solutions because…
- The business demands it.
- Solutions no longer try to do everything. The new environment is full of smaller, singular solutions solving different problems well.
- Each solution isn’t as complicated (or as expensive) as building a data warehouse or transitioning from a data warehouse to a data virtualization tool.
The Environment is Messy
Now, this environment will contain many solutions. Because we are used to looking for a single solution, the new environment will feel messy. The good news is, it can be organized.
Organizing Analytics Chaos
Joao Tapadinhas gave a great presentation on how to organize the chaos called “From BI to AI: Build the Business-Driven Data and Analytics Architecture”. He introduced the concepts of analytic moments and analytics blocks. These are tools to help with organizing analytics chaos at scale. Let’s start with analytics moments.
Analytics Moments
Analytics moments are analytical processes supporting the delivery of business outcomes. To explain, here’s an example of an analytics moment versus a business outcome.
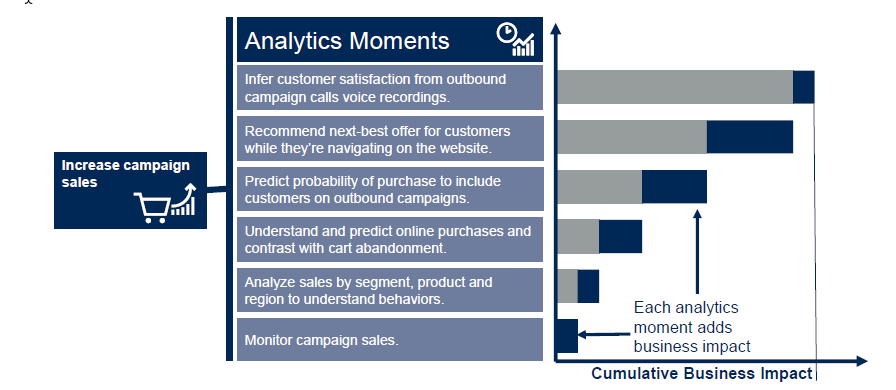
As you can see, analytics moments gradually get more complex. It’s possible that each moment will require different analytics capabilities. Clearly, you wouldn’t use the same tools to monitor campaign sales AND make recommendations on customer offers. This is where analytics blocks come into play.
Analytics Blocks
Analytics blocks refer to data, capabilities, and people used to deliver on analytics moments and business outcomes. They are used to organize analytics chaos. Also, they demonstrate how analytics capabilities support business outcomes. I know that sounds a bit cryptic. Stay with me. Joao did a great job of introducing the concept by first talking about what the business asks for versus what they really want.
As you can see, they ask for a capability. What they really want is a specific outcome. They want to use the capability to achieve an outcome.
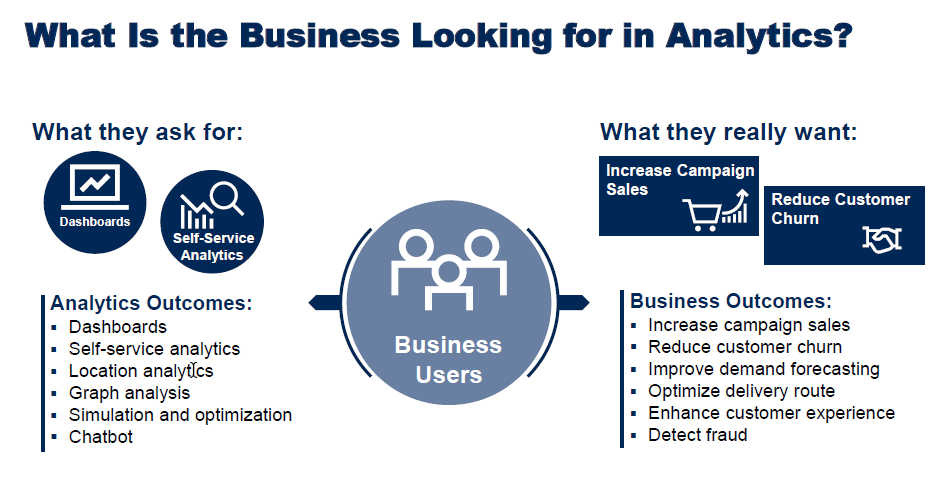
Now, this resonated pretty strongly with me. In my experience, this is exactly what happens. Ultimately, the outcome is the creation of ENORMOUS projects that take far too long to deliver.
I’m going to connect it all together, but let’s first solidify what an analytics block actually is. Here are a few examples broken down as data, analytics capabilities, and people.

Tying It Together
Now, let’s me create a picture you can relate to. Below, you can see a few examples of how blocks are incorporated to serve different analytics models (traditional, self-service, and predictive modeling). These are just examples so you can get the idea.

For me, organizing an analytics environment in this way feels good. It feels less chaotic and more organized. For example, a year or two ago, we spun up an analytics sandbox “experiment”. When it started, it felt messy. Only a handful of people knew how or were allowed to use it, but it’s been incredibly useful. Even though there has never been an official “declaration”, this experiment is now part of our analytics architecture. And that is where the mindset is changing. Each experiment is an important block in the architecture. Now, let’s talk about how to put it together.
Here’s how we do it…
- Start with business outcomes.
- Then, define the analytics blocks.
- Finally, put it together.
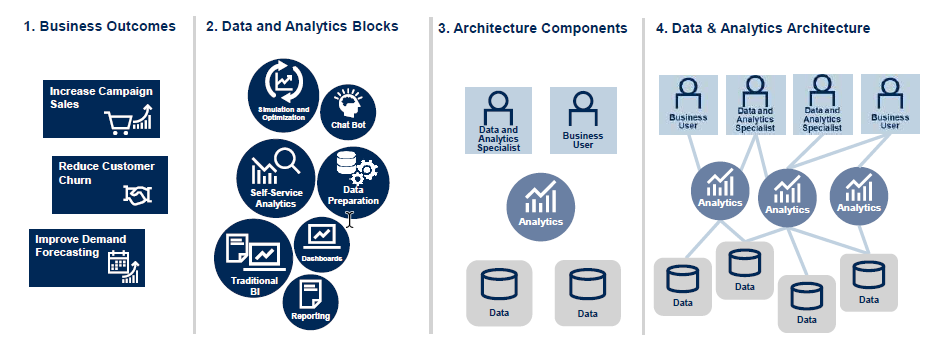
The result is an output explaining where data is coming from, who is interacting with it, and what capabilities are being utilized.
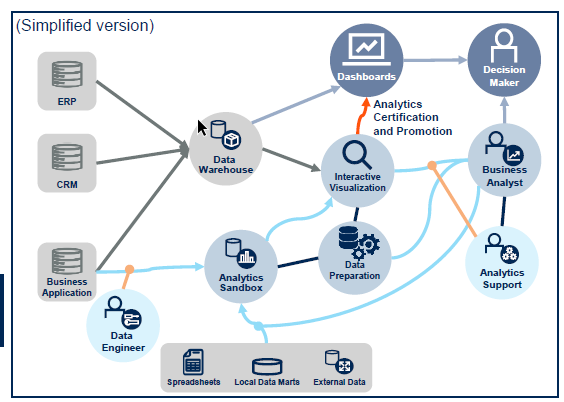
Now it’s clear how different capabilities are supporting different outcomes and where there is overlap.

This model also shows how to scale analytics. Scale-up by adding more capabilities, more outcomes, or new roles involved in the process. In the next post, I’ll speak directly to potential new roles.
Summary
In summary, if you truly want to build a data-driven organization, you must
- Using multiple solutions to solve different problems.
- Making sure everyone involved understands the environment they are working in. Consider using analytics blocks to communicate your architecture.
- Deploying scalable solutions.
- Experimentation
For me, the concepts of analytics moments and analytics blocks helped provide structure to the chaos. They also demonstrate how current and future problems can be solved. In conclusion, please note, all pictures/slides came from the presentations and authors quoted herein. The interpretation of the content is my own.
If you enjoyed this, read the other two posts in the series on Governing Self-Service BI and how to Drive Analytics Innovation with Efficiency.
Pingback: Key Messages from the Gartner Analytics Conference -- Self Service Should Be Governed • The Analytics Corner
Pingback: Key Messages from the Gartner Analytics Conference -- Make Efficient, Automate, Then Innovate • The Analytics Corner
Pingback: 5 Ways to Increase Speed of Delivery » The Analytics Corner
Pingback: Key Messages from the Gartner Analytics Conference » The Analytics Corner