This is post 9 in my series on how to learn the Spotfire expression language. It explains the Parent and ParallelPeriod node navigation methods. Originally, I included NavigatePeriod, but NavigatePeriod deserves its own post, so it will follow next week. Read on to learn about Parent and ParallelPeriod node navigation methods.
As with previous posts, I will show each node navigation method in a custom expression and a calculated column. Just remember it’s not possible to navigate a hierarchy when using most node navigation methods in calculated columns. If you’re not sure what that means, don’t worry. You’ll see more examples of this with both Parent and ParallelPeriod. Let’s start with Parent.
Parent
The Parent node navigation method lets you reference the parent node (and only the parent node) of a hierarchy. What is the parent node exactly? I’ll explain by using a 2-level hierarchy and a 3 level-hierarchy.
Custom Expression
Calculation objective: For a data set that includes 3 months of production, what percentage is each month of total production.
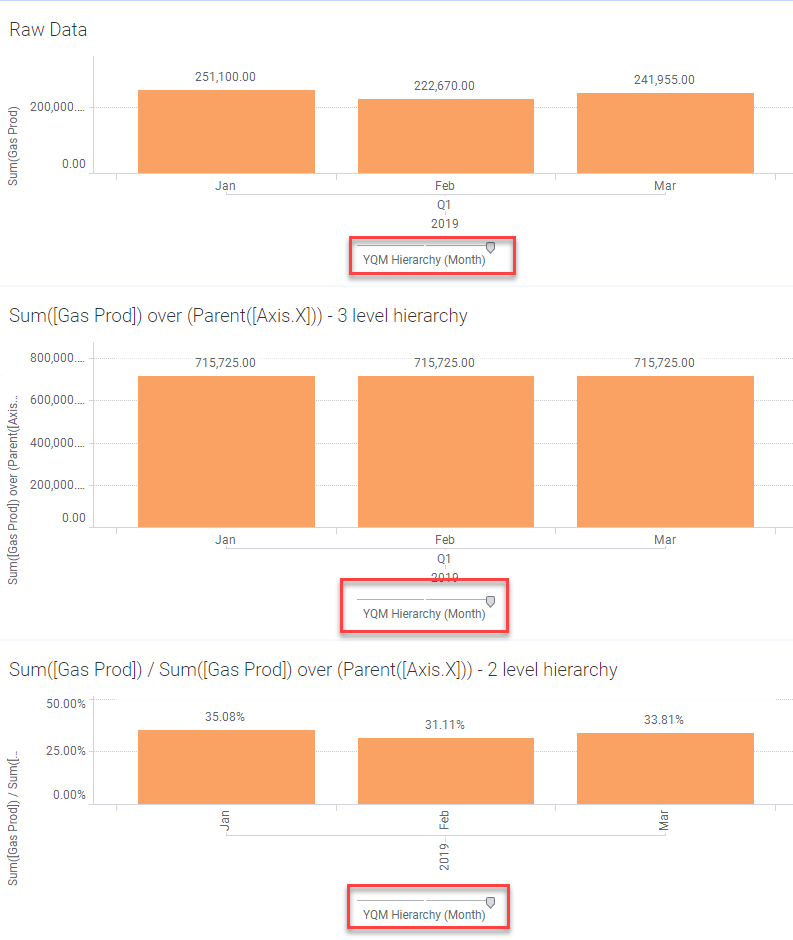
Sum([Gas Prod]) / Sum([Gas Prod]) over Parent([Axis.X])In the example below, the hierarchy includes the Year and Month. The Parent is the Year. The first chart shows the raw data for 3 months. The second chart shows what Sum([Gas Prod]) over Parent([Axis.X]) references. The third chart calculates the desired percentage. Notice that in the second chart, the value is the same for each month. That is because the expression is asking for the sum of the parent node (i.e. the sum of gas prod for the year).

That makes sense, but what happens when I change the hierarchy to a 3 level hierarchy? Is Year still the parent?
The answer is yes. I show the same three charts below, but I have changed the hierarchy from a 2-level (Year, Month) to a 3-level (Year, Quarter, Month). The hierarchy slider is set to month, but year is still the parent, even though quarter is above month. The parent is the topmost level of the hierarchy.
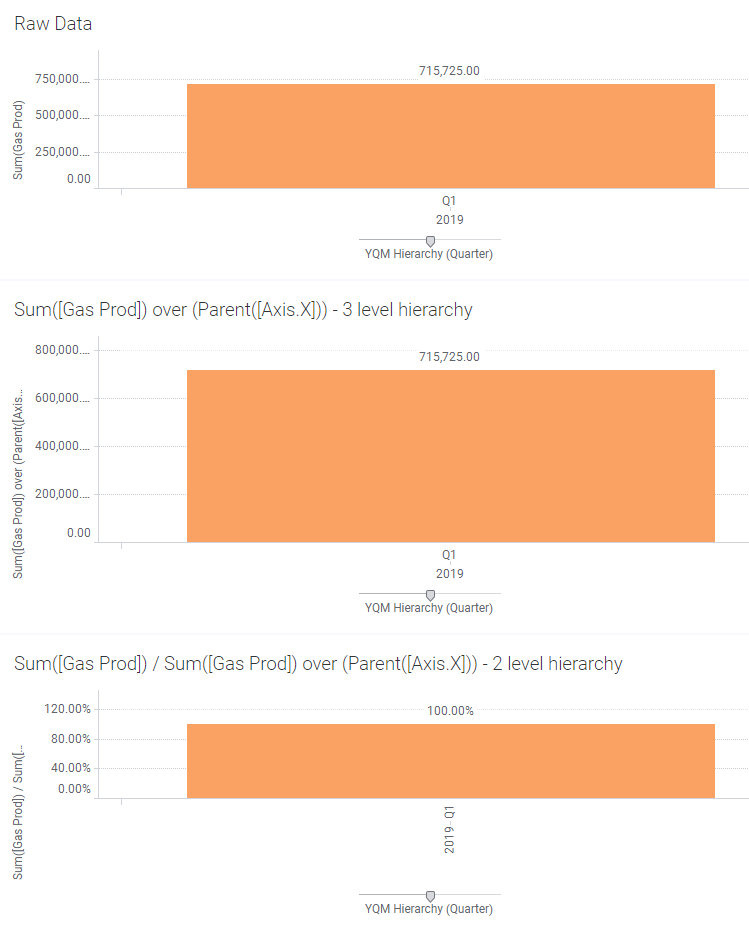
If I move the hierarchy slider to quarter, it tells me what percentage Q1 2019 is of all 2019. Because my data set is only 3 month (i.e. one quarter), the result is 100%.
Calculated Column
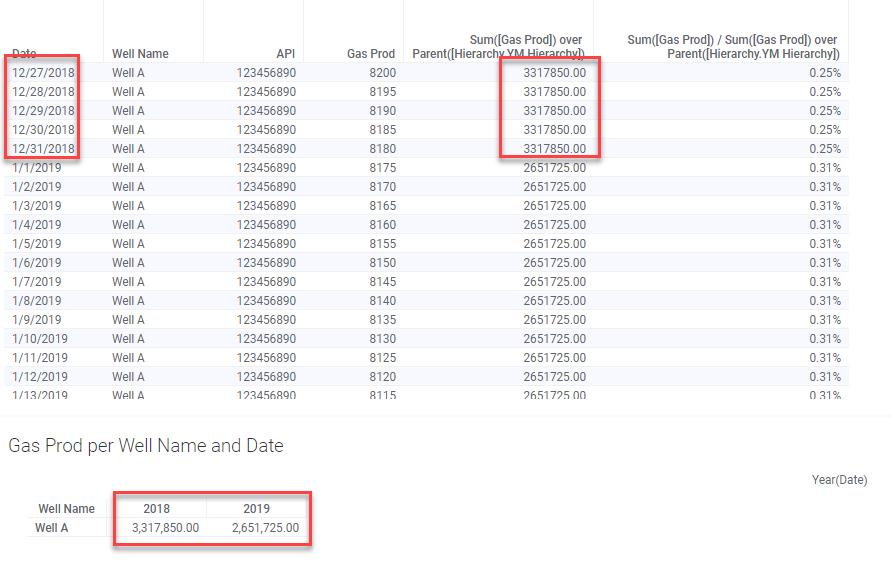
Here, I have replicated the calculation in a calculated column. As you can see the calculation always references the highest level of the hierarchy, the year. I took the screenshot where the year changes to make this clear. The downside of this calculated column is that it will always use the entire data set. And, if I want to calculate the percentage each month contributes to the year, I have to do more calculations to get a sum for a 3 month period. It was much easier to write the calculation as a custom expression.
Now let’s move on to ParallelPeriod.
ParallelPeriod
ParallelPeriod is pretty hard to describe in words. I tried several variations but they all sound convoluted, which is why reading the TIBCO help didn’t help me my first time around. Let’s look at an example.
Custom Expression
Calculation objective: Calculate the difference in production between Q1 of this year and Q1 of last year
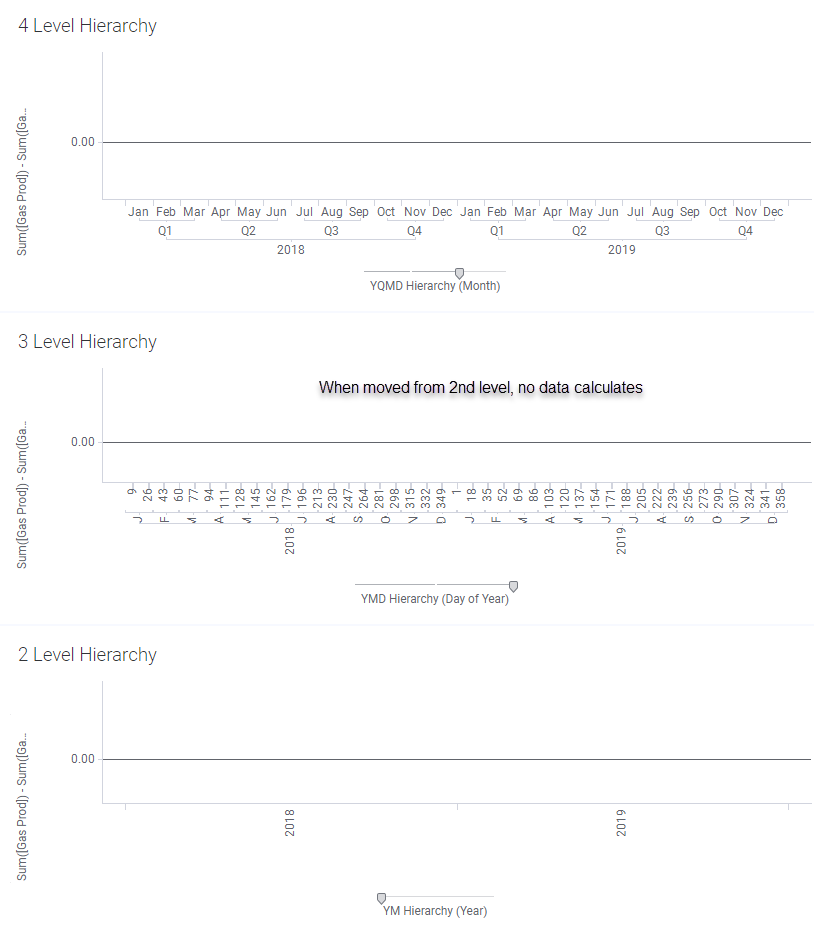
Sum([GAS]) - Sum([GAS]) over (ParallelPeriod([Axis.X]))Below, I have three visualizations shown. They differ in the hierarchy on the X-Axis. The first is a four-level hierarchy (year, quarter, month, day of year). The second is a three-level hierarchy (year, quarter, month). The last is a two-level hierarchy (year, month). Notice that the hierarchy sliders are all set to the second level. At that setting they calculate the difference in production between quarters year over year, between months year over year, etc.
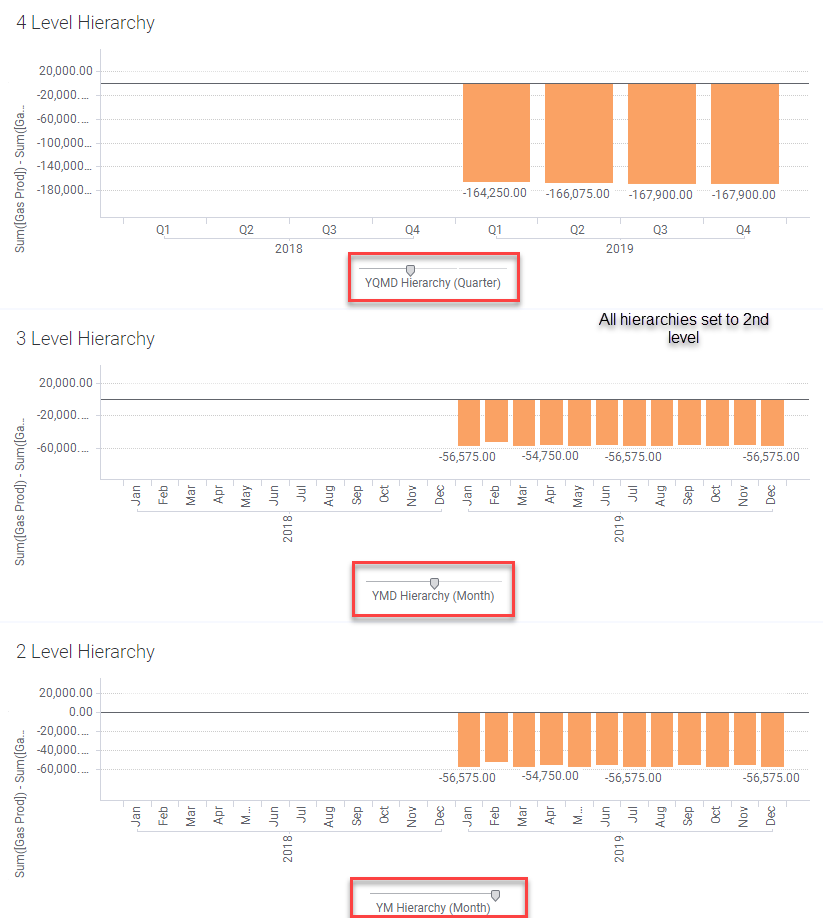
If I move the hierarchy sliders, to anything other than the second level, no data is calculated. I expected this to calculate but it only works between the top level of the hierarchy and the one below it. Users must create hierarchies accordingly to use ParallelPeriod.
Calculated Column
Using ParallelPeriod in a calculated column also had a few surprises. To explain, here are the values of production for each month, starting in 2018.
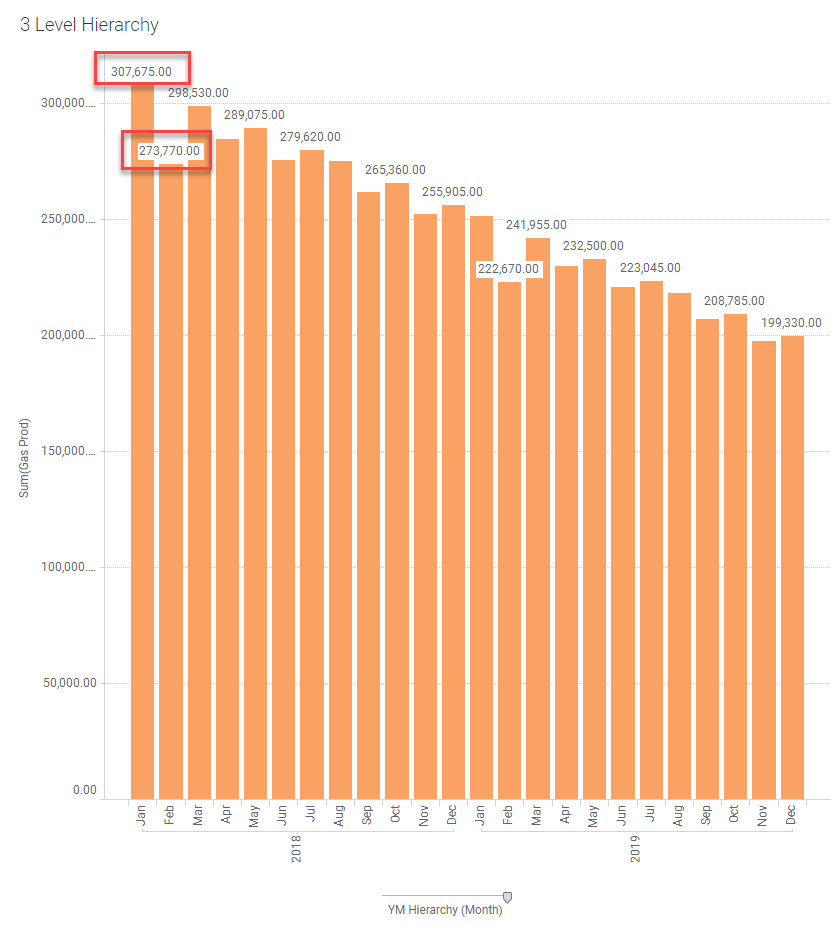
Before I try to calculate the difference in production between Q1 of this year and Q1 of last year, I enter the calculations shown to make sure I know what ParallelPeriod is doing. In my first attempt, which uses the YM hierarchy, the values match the visualization. Remember, it’s going to show me the 2018 values in the 2019 records because I am asking for the ParallelPeriod. But, when I try to use the YQM or the YQMD hierarchies I get nothing. I demonstrated in the custom expression that the hierarchy slider always has to be on the second level. In calculated columns, Spotfire always starts at the most granular level and goes up. Thus, anything more than a 2 level hierarchy will produce a null result.

As I was writing this, I started to ask the question of — How is PreviousPeriod different from ParallelPeriod. For a second, I thought they were the same, but there is a subtle but important difference between PreviousPeriod and ParallelPeriod.
Sum([Gas Prod]) over PreviousPeriod([Axis.X]))
Sum([Gas Prod]) over ParallelPeriod([Axis.X]))
For a year/month hierarchy set on the month, PreviousPeriod would show us the previous month in the same year. ParallelPeriod would show the same month in the previous year.

Wrap Up
That explains everything you need to know about Parent and ParallelPeriod. Now you are only one node navigation method away from understanding all that Spotfire has to offer. I’m very excited to show you NavigatePeriod next week because it fills in all the gaps with regards to the flexibility of calculations.
Spotfire Version
Content created with Spotfire 10.2.
Other Posts in the Series
- How to Learn the Spotfire Expression Language
- How to Use Axis Names in Spotfire Cross Tables
- Using the Over Keyword to Slice and Dice Calculations
- Node Navigation in Spotfire
- Using the Intersect Keyword
- Using the Then Keyword
- Node Navigation – All, Next, Previous, AllNext, AllPrevious
- Node Navigation – LastPeriods, FirstNode, LastNode, PreviousPeriods, NextPeriods

Pingback: Spotfire Axis Names on Bar Charts » The Analytics Corner