Welcome to part 4 of my Spotfire Data Limiting Series. The first post in the series covered data limiting with the filter and data panels. The second post talked about data limiting in the web player. The third post discussed limiting using filtering schemes. Now, we are on to limiting with marking, which many people know as creating details visualizations. This is one of my favorite features of Spotfire, and it’s one of the application’s many interactive features.
This post will be a quick and easy read. I’ll begin with a brief explanation of what data limiting with marking is (and where to find it in the menus). Then, I’ll explain when to use it and when not to use it. For those who like video, this post includes a video demonstration farther below. For those who like to read rather than watch, carry on.
What is Data Limiting with Marking
Data limiting with marking involves two or more visualizations. Think of one as the parent and one (or more) as the child or even
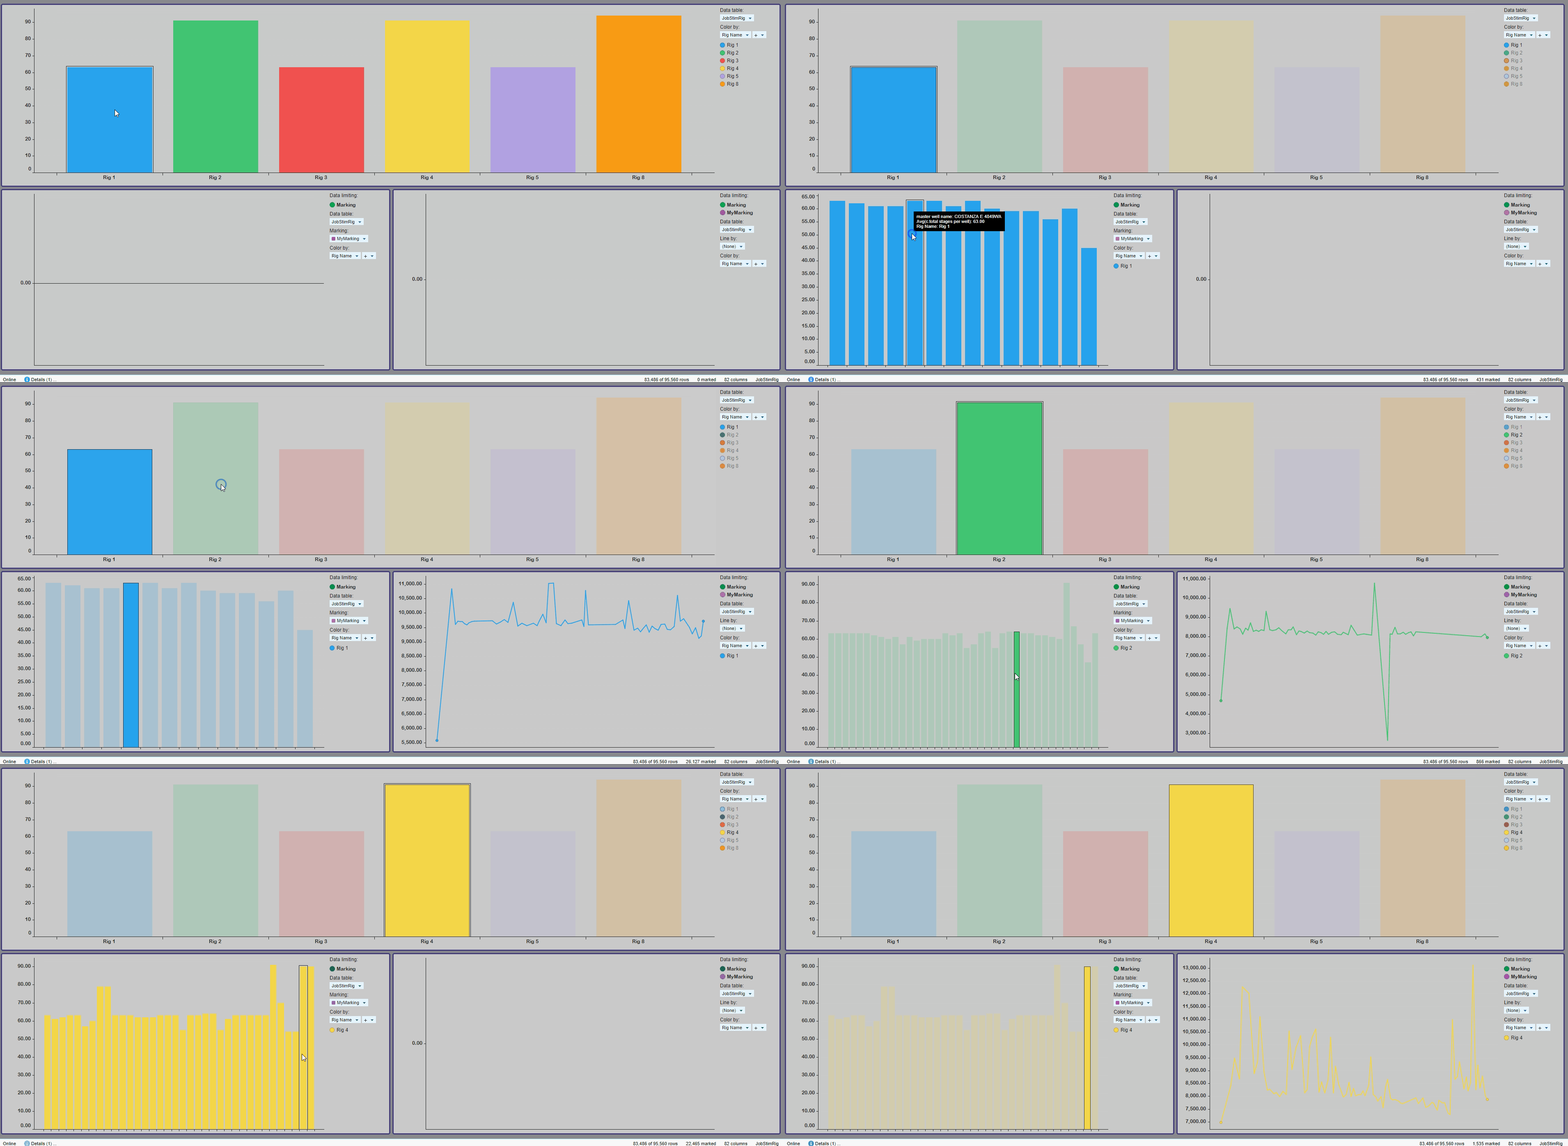
The developer should configure the legend to indicate the visualization is limited with marking as shown here. This helps the user clearly understand which is the parent and which is the child.
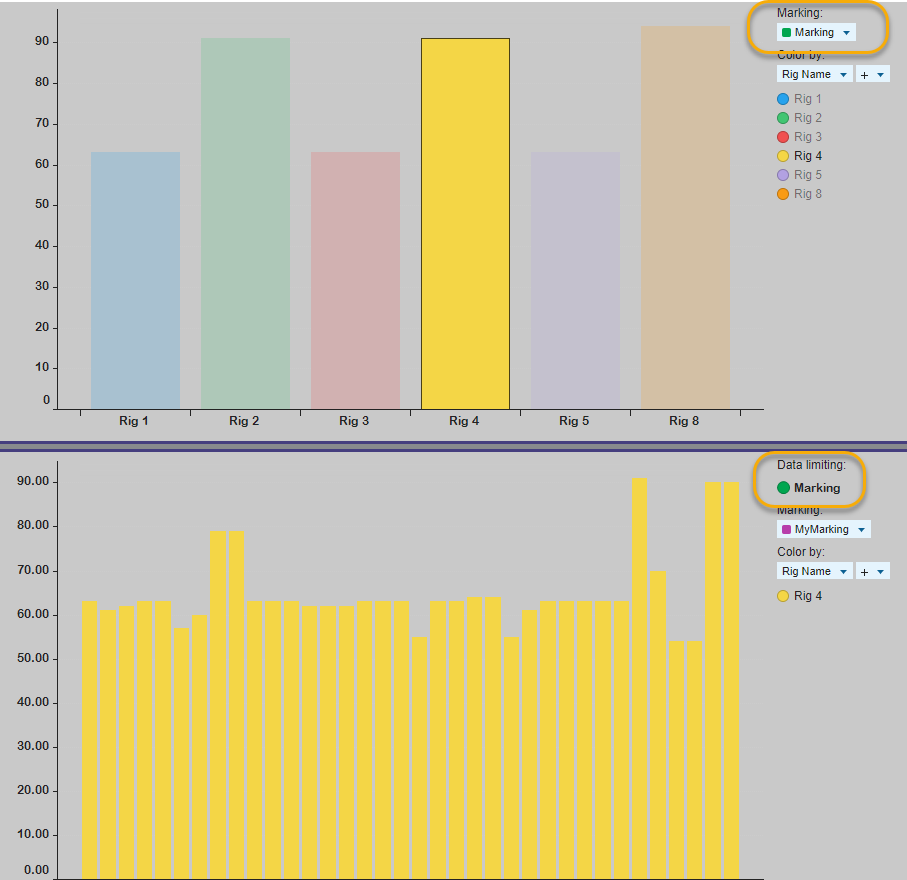
Now, let’s talk about how to set this up.
Setup
There are two ways to create this parent/child relationship between visualizations.
Right-Click Method
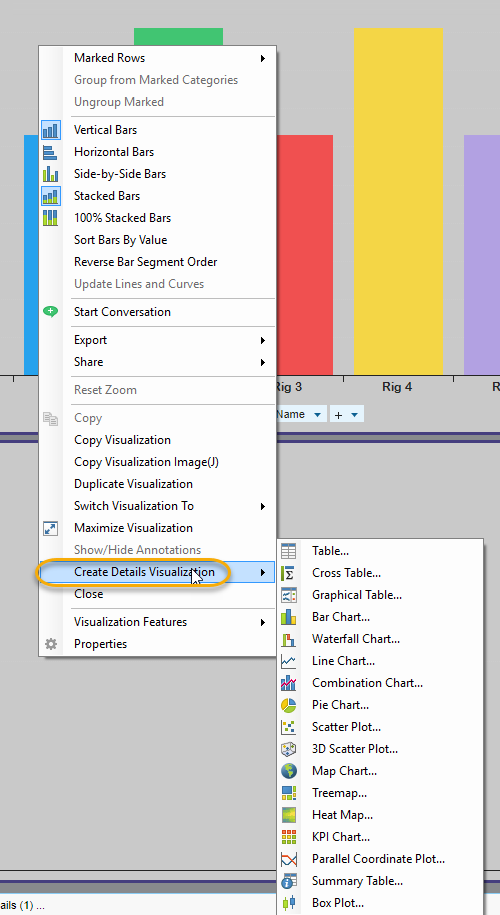
Simply right-click on the parent and select Create Details Visualization, as shown here.
Now, what if you need to make a change after creating the details visualization? Perhaps you want the child connected to a different parent. Well, under the covers, all the
Configure Marking Method
To use this method, go to the visualization properties of the child, and choose to limit by the marking of the parent. A demonstration is shown below.
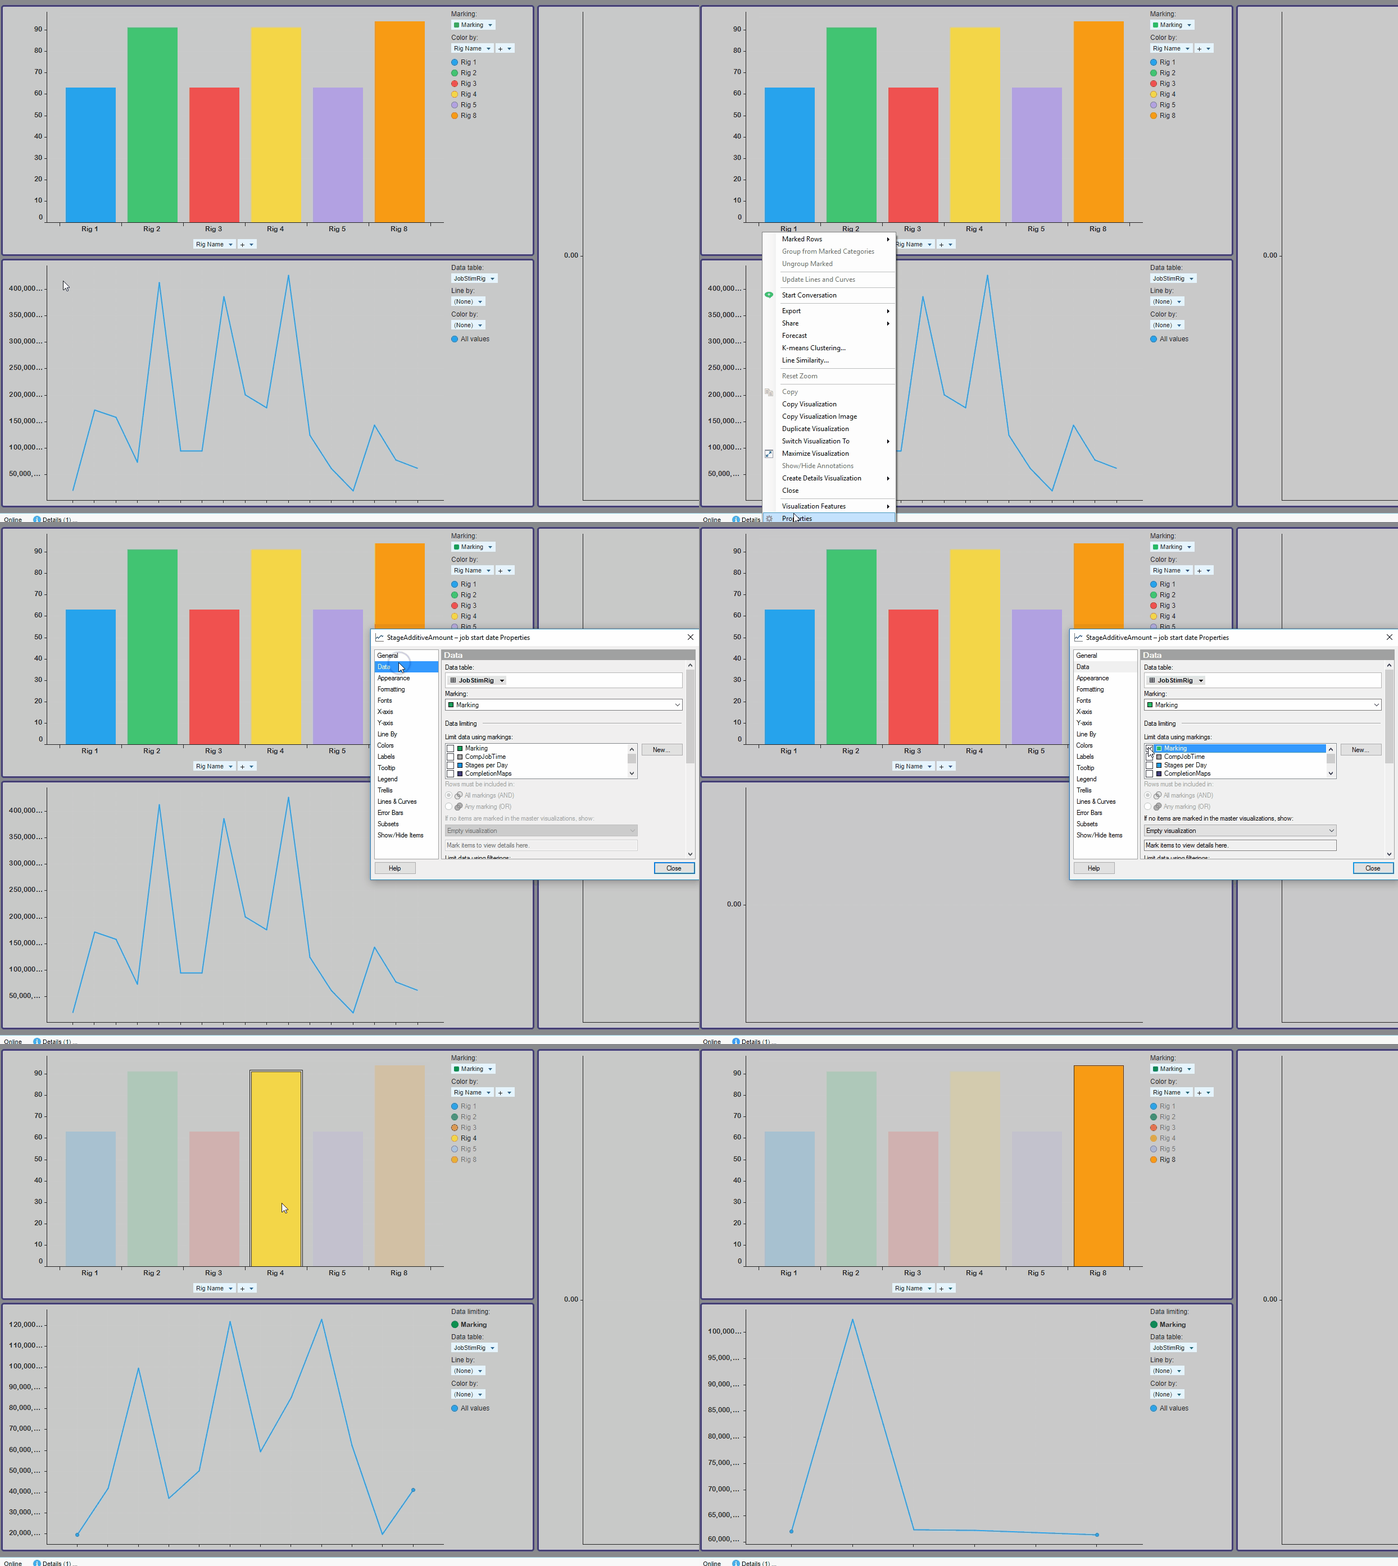
If you use the first method shown (right-click, create details visualization), the application does this step for you.
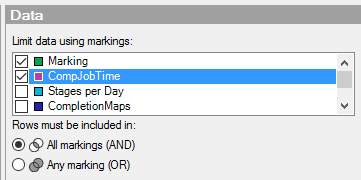
Note: It is possible to configure details visualizations with multiple markings, called overlapping markings. When using overlapping markings (i.e. check more than one box), you will also need to specify which rows should be included with the radio button.
Additional Config
I distinctly remember the first time I opened a Spotfire analysis (when I was working at Shell), and I saw a ton of blank visualizations. I had no idea how to interact with them and just thought the whole setup was stupid. Don’t do this to your users. Configure the child visualizations with a message instructing them what to do. This is done in the Data menu. Select the option to have a Message on

Now that setup is complete, let’s talk about when to use this feature and when not to.
When to Use Limiting With Marking
- Use limiting with marking when moving thru a defined workflow or line of specific questions and answers.
- When the “main” visualization(s) will surely generate questions on the data behind the visualization and users will want the answers in the form of another visualization (as opposed to the table shown in the details on demand panel).
- Use when you don’t need all the data on a visualization, just a subset.
- When you have an idea of the questions a user will ask but not the specifics.
When Not to Use Limiting With Marking
- Don’t use limiting with marking when the line of questioning is uncertain.
- When the user won’t frequently use the details visualizations. In this case, they just take up space.
Conclusion
Well, that wraps up data limiting with marking. Next week, I’ll cover data limiting with expressions.
Spotfire Version
Content created with Spotfire 7.12.

Pingback: Data Limiting In Spotfire • The Analytics Corner
Pingback: Part 5 - Data Limiting With Expressions » The Analytics Corner
Pingback: Part 6 - Data Limiting with Subsets » The Analytics Corner
Pingback: Part 7 - Data Limiting with Rules » The Analytics Corner
I need to know how marking works between different data table in spotfire
Can you be more specific about what you are trying to accomplish? You might also want to check out my posts on relations and column matches. You need column matches to have integrated marking between tables — https://www.bigmountainanalytics.com/apply-relations-and-column-matches-in-spotfire/, https://www.bigmountainanalytics.com/how-to-use-relations-in-spotfire/, https://www.bigmountainanalytics.com/how-to-use-column-matches-in-spotfire/
Hi Julie,
i have been trying to drilldown through cross table viz but it takes entire row when clicked,want to get drilldown based on single cell of row
That might be outside its functionality. What version are you on?