Welcome to part 6 of my Spotfire Data Limiting Series. The first post in the covered data limiting with the filter and data panels. The second post talked about data limiting in the web player. The third post discussed limiting using filtering schemes. Then, I covered limiting with marking. Last week touched on limiting with expressions. This week, we talk about data limiting with subsets.
Very few users know about limiting with subsets. When I took TIBCO’s Spotfire Essentials course, subsets were covered. I subsequently eliminated them from my own Essentials training as there was just too much to learn. I don’t use them very often, so this post was a great opportunity for me to revisit and rethink when they are most useful.
I’ll begin this post with a brief explanation of data limiting with subsets. Then, I’ll show you how to set them up. Finally, I’ll explain when to use them and when not to.
What is Data Limiting with Subsets?
Data limiting with subsets is applied to individual visualizations in a manner similar to limiting with expressions. However, limiting this way assists with comparing and contrasting data rather than strictly limiting data. In this respect, it is unique.
Setup
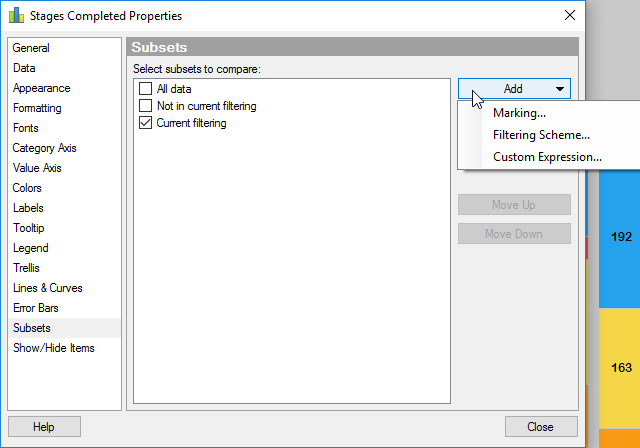
To create subsets, go to the Properties of a visualization, go to the Subsets menu.
As you can see in the screenshot below, subsets can be created from marking, filtering schemes, or from the defaults shown in the menu.

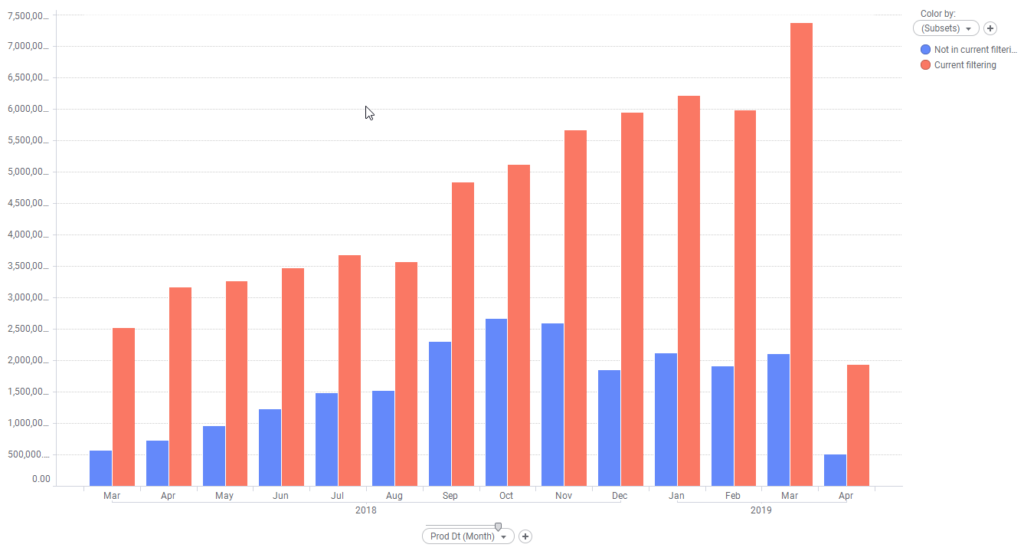
To demonstrate the concept, here is an example of limiting with subsets when I check both the “Current filtering” and “Not in current filtering” boxes. The result is a visualization that groups filtered and non-filtered data. In this case, I am looking at production data, and I have filtered out specific areas of the field.

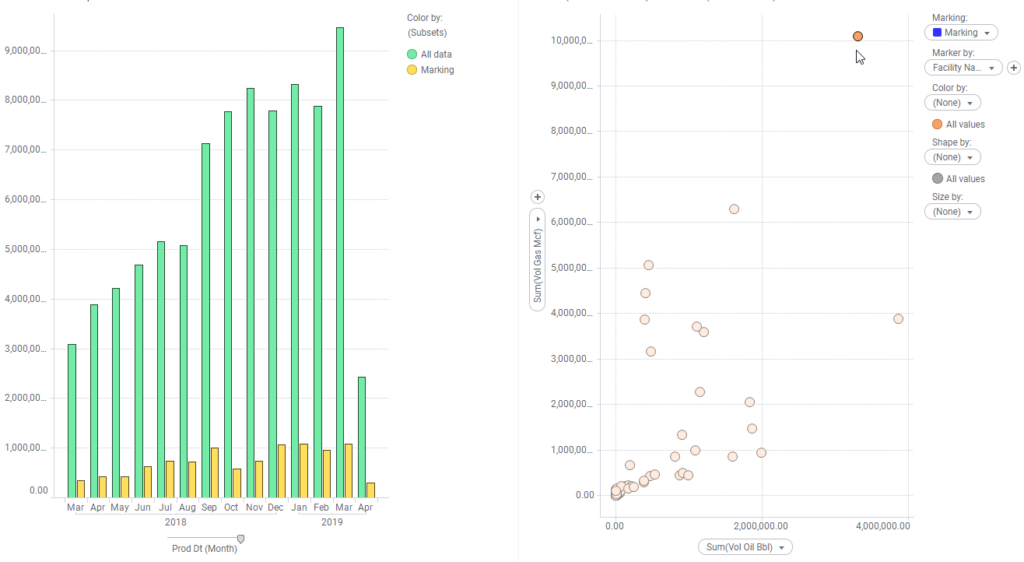
In the example below, I have set up the bar chart on the left with all of my production data for a period of time and a subset based on marking. When I mark the scatter plot to the left, which has one marker per facility, that facility’s production will show up in contrast to all the data.

Marking subsets is very similar to details visualizations where you mark one visualization and another populates. The main difference is that it provides additional information to what is already in a visualization. If no data is marked, only the green bars would appear. Thus, this is a valuable tool to compare data sets.
You can also use custom expressions and filtering schemes to create subsets, but the idea is the same.
When to Use
- Use subsets when you want to group data and those groupings might change frequently. Generally speaking, I prefer to use binning if my groupings aren’t going to change because updating bins frequently are tedious and subsets are more efficient.
- Choose subsets with markings when you might want to see additional data on a visualization. In this case, you won’t see additional data unless data is marked.
- Use when you want the analysis to be interactive.
When Not to Use
- Do not use if users are not familiar with markings or filtering schemes.
- Do not use if you think subsets will confuse users.
In summary, subsets are a unique feature in Spotfire that probably aren’t used nearly enough. They would save users the hassle of creating additional visualizations to get more insight.
Spotfire Version
Content created with Spotfire 10.2.
Pingback: Data Limiting In Spotfire • The Analytics Corner
Pingback: Part 7 - Data Limiting with Rules » The Analytics Corner