Skip to content

property controls

How To Create Drop Downs in Spotfire Text Areas

After 5 years of blogging about Spotfire, I’ve written very little about using property controls, which is a shame because they are one of Spotfire’s best features. It’s time to fix that with a 7 part series on how to create each of the different types of property controls. This week, we’ll start with what is perhaps the most used property control, the dropdown. Read on to learn how to create drop downs in Spotfire text areas.

Read More »How To Create Drop Downs in Spotfire Text Areas
Using Document Properties to Control Data Limiting by Expression

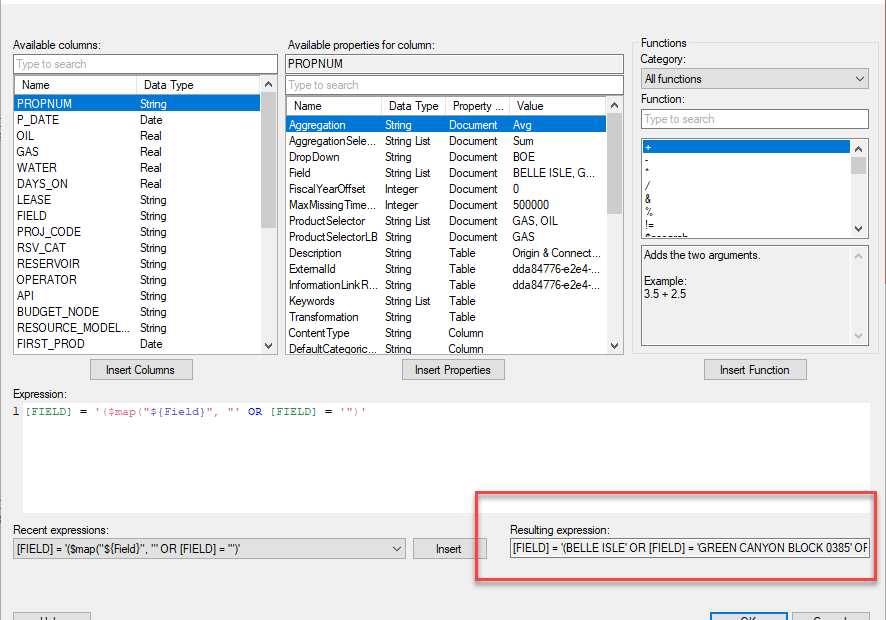
I love data limiting with expressions! It is my go-to method for data limiting because it is the most flexible. However, I found myself updating expressions over and over in tons of charts. It was just inefficient and painful. Then, I learned how to connect document properties to my expressions. Now, I know how to be more efficient in my data limiting. I promise this is worth your time! Read on to learn more.

Read More »Using Document Properties to Control Data Limiting by Expression

$esc and $map Functions in Spotfire

A while ago, I started a series on learning the Spotfire expression language. I made a lot of progress on it but got pulled off on a few side quests. This week, I return to that theme with an explanation of how to use the $esc and $map functions in Spotfire. Knowing how to use these functions will allow you to connect visualizations to property control to provide a more interactive experience for users. It will also give you greater insight into how Spotfire expressions really work. Read on if you want to be able to…

  • Create dynamic visualizations that update with changes to property controls.
  • Use data limiting with property controls.
Read More »$esc and $map Functions in Spotfire

Creating Dynamic Display Names for Spotfire Visualizations

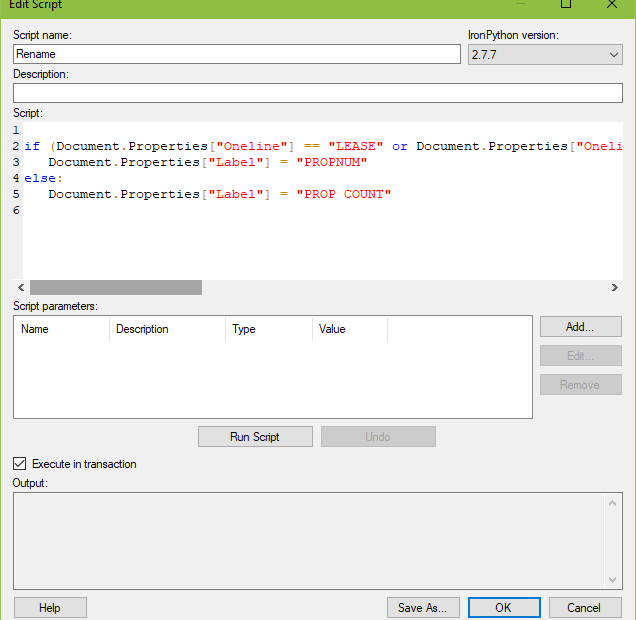
A coworker reached out to me for help on a visualization. He was using a drop-down property control to set the value of a bar chart x-axis. If he chooses option 1 or option 2, the display name should be a certain value. If he chooses option 3 or option 4, a different value should appear. I’ve definitely had this come up before when using dropdown property controls. There is an IronPython solution for creating dynamic display names. Let me show you.

Read More »Creating Dynamic Display Names for Spotfire Visualizations

How To Make Type Curve Inputs More Efficient

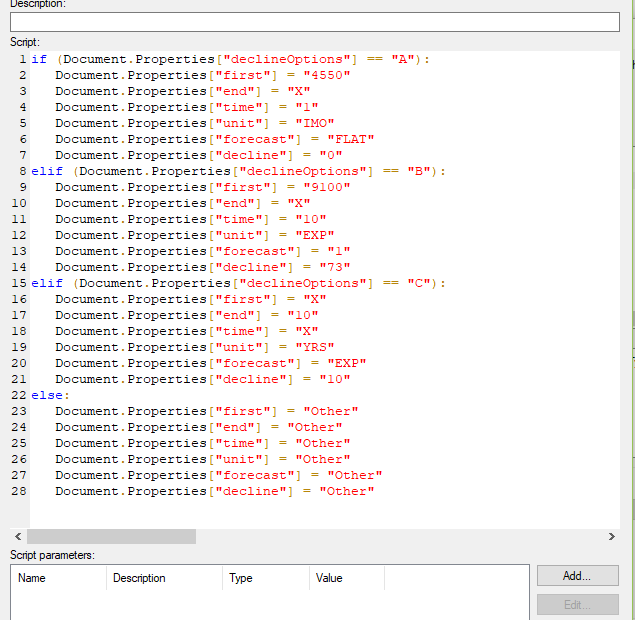
Type Curve generators are standard in reservoir engineering workflows. They are also a bit problematic. They require lots of inputs, which are time-consuming to build and fill out. You can’t easily recreate them in other projects. Therefore, my next two posts will show you how to make type curve inputs more efficient. The first post will demonstrate how to populate type curve inputs with IronPython and toggle between different sets of inputs. The second post will go further by allowing users to load type curve settings in a table. Then, the user tells an R function which row to pull from the table and place in the type curve inputs. Read on for these great solutions!

Read More »How To Make Type Curve Inputs More Efficient

How to Reset Marking When Changing Pages

  • Would you like to know how to reset marking when changing pages in an analysis?
  • Are you worried about users getting confused with markings on different pages and would like them to reset?
  • Are you using the same markings in multiple visualizations in an analysis?

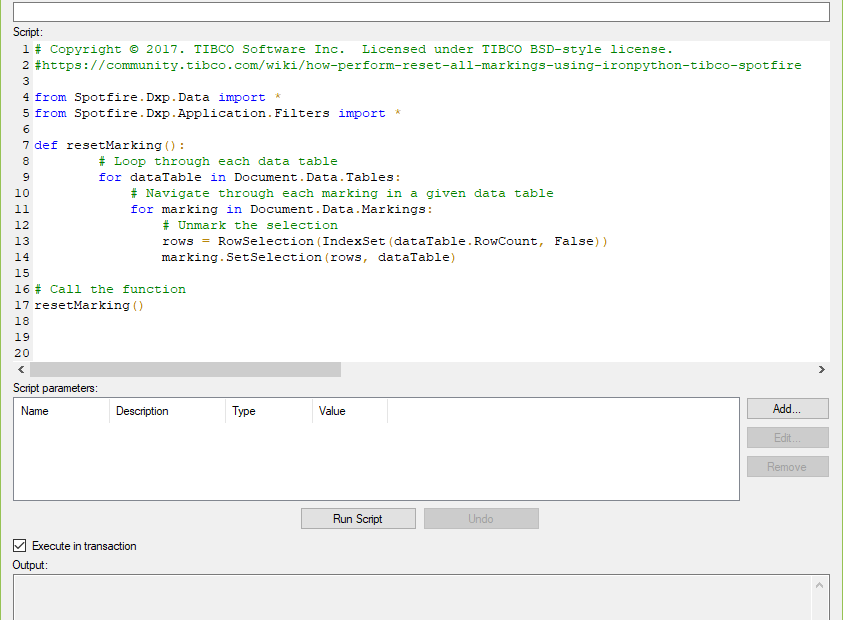
If you answered yes to any of these questions, read on to find a simple solution that will reset all markings when a user moves to a different page.

Read More »How to Reset Marking When Changing Pages

Change Visualization Titles with IronPython

I promised a return to Spotfire API for IronPython posts, and that is finally happening. I had to get a few drafts cleared out, like 5 Ways to Approach Troubleshooting Data Problems, but now I’m back on track discussing how to change visualization titles with IronPython

In October last year, I committed to spending 100 hours learning IronPython. I wrote several “starter” IronPython posts, which can be found in the Data Shop Talk Archive. I have lost count of how much time I’ve spent on IronPython, but the clock starts again today.

My goals haven’t changed. They are still to ….

  1. Get an understanding of IronPython structure
  2. Develop an understanding of the Spotfire API
  3. Apply that understanding in Spotfire code examples

For the next several weeks, I’ll be using the code snippets posted on The Spotfire IronPython Quick Reference to explore the API. I’ll punctate that with an article here and there are the IronPython/Python structure as I go. Read on for this week’s code snippet.

Read More »Change Visualization Titles with IronPython