At the end of last week’s post, I promised to continue with examples of all node navigation methods. But, I have decided to wrap up keywords first. Thus, this week’s post will explain how to use the “Then” keyword. Then is incredibly useful in Spotfire because it allows you to specify the order of calculations in an expression. In other words, “calculate this and THEN calculate that”. However, there are a few places you can get tripped up. Read on to learn more.
In my first post, I explained that there are multiple ways to create calculations in Spotfire. Primarily, users insert calculated columns into tables, or they write expressions on the axis of a visualization. And, not all keywords and functions are usable in both instances. The Then keyword is one such case. Let’s look at a simple example.
Use Case No 1
The easiest way to understand the Then keyword is by utilizing the Cumulative Sum aggregation provided in the aggregation dropdown. In the example below, I am calculating the Cumulative Sum of Gas Prod. After selecting Cumulative Sum from the list of aggregation methods, Spotfire’s “under the hood” expression becomes visible.
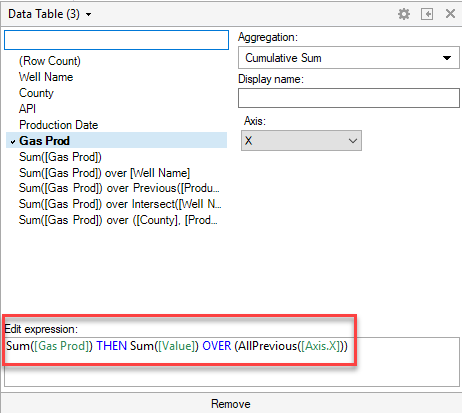
But what is it doing? How does this work? Here are the steps in sequential order.
- Sum Gas Prod for each node (for each Production Date).
- Then, pass those values forward to a “column” of data called “Value”.
- Sum those values for each previous node(s) (Production Dates).
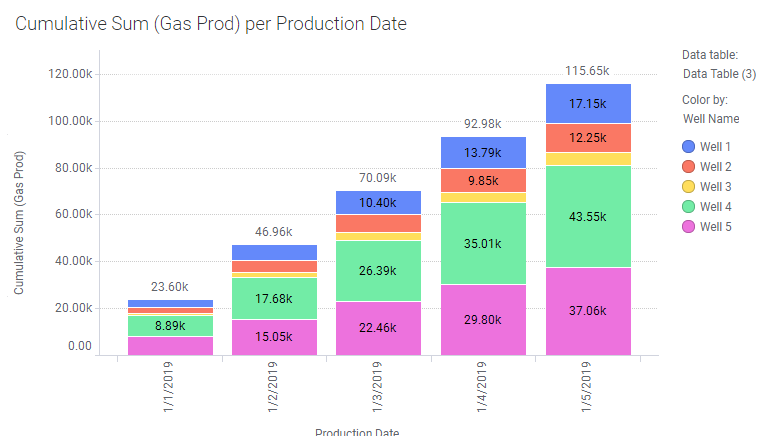
Here is the data in chart and tablur form for greater clarity.

Caveats
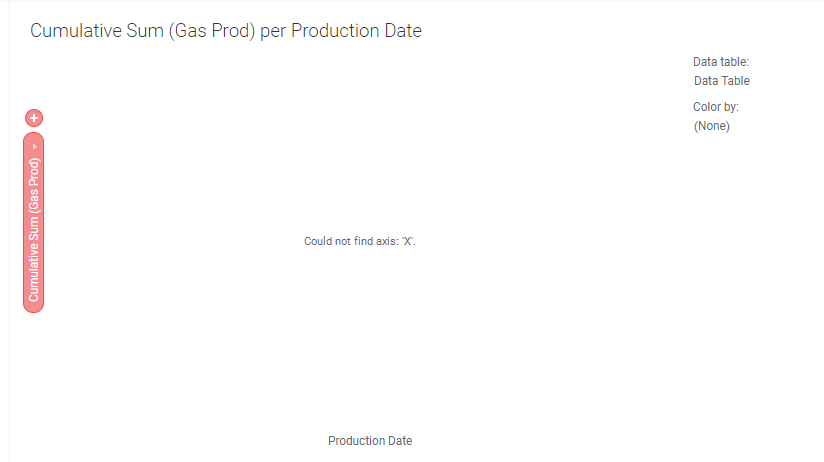
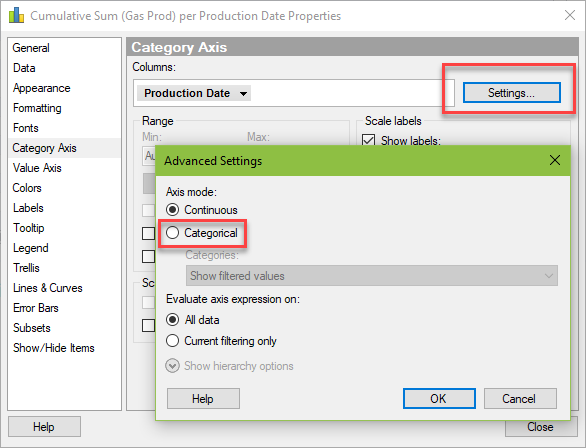
There are a few caveats to be aware of. First, in order to work, you must set the x-axis to categorical. It cannot be continuous. You will get this error if the x-axis is continuous.
This is very easy to change in Properties as shown below.
Second, if you want to achieve the same result in a calculated column in a table, you cannot simply copy and paste the same expression and replace [Axis.X] with the column of data from the x-axis. Spotfire throws an error saying the expression is not valid. It won’t even recognize the valid column of data.
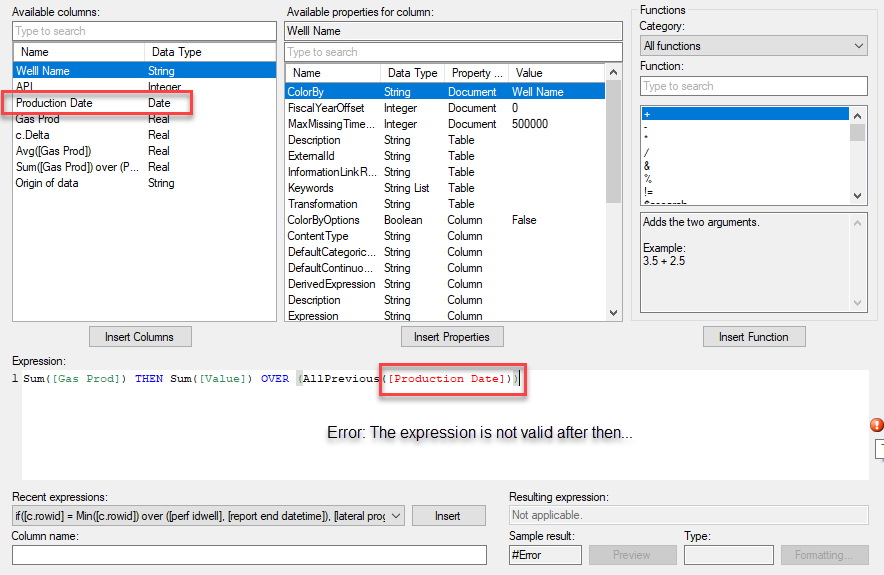
You can achieve the same calculation in a table. It’s just done a bit differently.
Instead of this expression.
Sum([Gas Prod]) THEN Sum([Value]) OVER (AllPrevious([Axis.X]))Write this one.
Sum([Gas Prod]) over (AllPrevious([Production Date]))Because that was a very simple use case, I want to show you a more complex example.
Use Case No 2
I wrote the following expression on the axis of a visualization to calculate the YTD average stages per day. Stages per day is equal to the stage count divide by pad hours minus downtime. As you can see, I gave Spotfire my “base calculation” and used the Then keyword to pass it forward to the Value “column”. After Sum([Value[) OVER, the expression is calculating a YTD moving average. Eventually, my calculation series will explain NavigatePeriod. For now, this is where I am going to end.
Sum([stage count)]) / ((Sum([pad hours)]) - Sum([weather downtime)])) / 24) THEN Sum([Value]) OVER (Intersect(AllPrevious([Axis.X]),NavigatePeriod([Axis.X],"Year",0,0))) / Count() OVER (Intersect(AllPrevious([Axis.X]),NavigatePeriod([Axis.X],"Year",0,0))) as [YTD avg]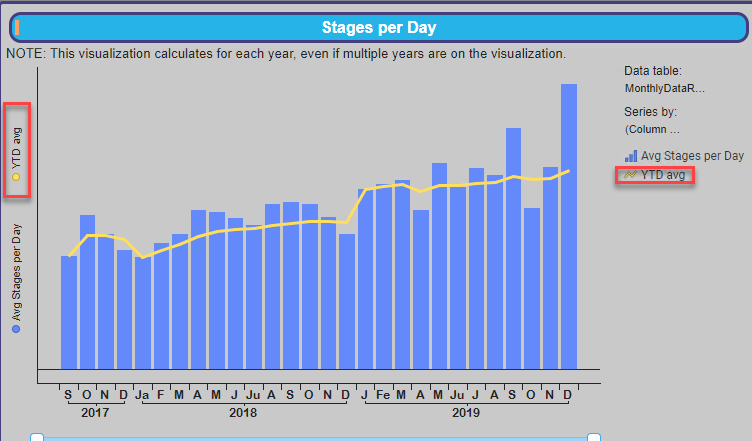
Wrap Up
In conclusion, the Then keyword is a very handy tool in the Spotfire set of keywords and functions. It allows you to order calculations when writing expressions on the axis of a visualization. It cannot be used to write expressions into tables. But, you can still write a similar expression to achieve the same outcome. Next week, I’ll dive deeper into node navigation methods.
Spotfire Version
Content created with Spotfire 10.2
Pingback: Node Navigation - All, Next, Previous, AllNext & AllPrevious » The Analytics Corner
Pingback: Spotfire Errors Querying Two MS Access Tables » The Analytics Corner
Pingback: Master NavigatePeriod Node Navigation » The Analytics Corner
Pingback: How to Save Space in Spotfire Tooltips » The Analytics Corner