A few months ago I started a series on Learning the Spotfire expression language. I covered the basics of calculations, keywords, node navigation, and a handful of functions. Now, it’s time to move on to axis names. If you’ve have been wondering how you can take your intermediate Spotfire skills to advanced, this is it. Axis names are very powerful, although not at all intuitive. And, there are a lot of them. This post will introduce the Spotfire axis names and the syntax. Detailed examples of all 20 axis names will follow in subsequent posts. Read on to learn more.
Blog or Video
What is an axis? What is an axis name?
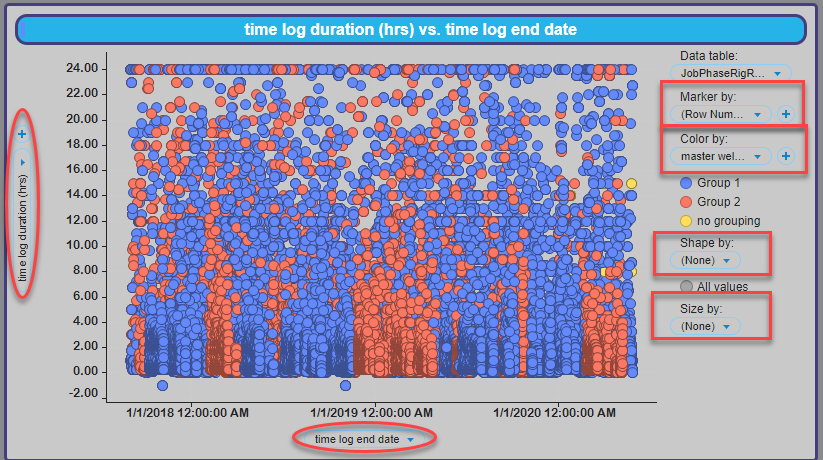
Most likely, when you think of the term “axis”, you think of the X or Y axis of a visualization. That is correct but incomplete. Spotfire uses the term “axis” to refer to any point or place on a visualization where you place data, including the Color by and Trellis selectors. Everything circled in the visualization below is an axis.

When writing custom expression, you may want to refer to an axis from the visualization in the expression. The axis name is how you do that. The axis name is essentially the syntax to reference the axis itself.
What are examples of axis names?
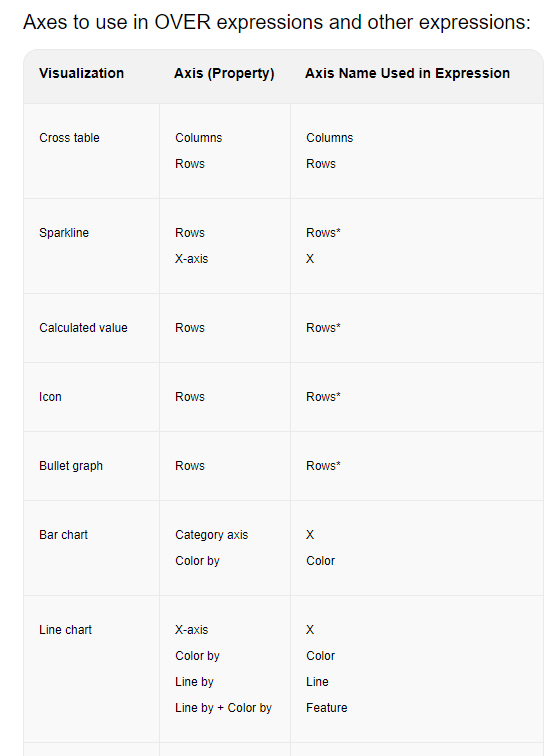
If I have counted correctly, 19 different axis names can be applied to the 14 visualizations available in Spotfire. Although, some axis names are only meant for use with rules or reference lines. And, axis names are specific to certain visualizations. The chart below is a snippet of the full reference you can find on this TIBCO website.

Why use axis names?
There are two very good reasons to use axis names. First, they incorporate filtering. As I mentioned in the first post in this series, there are three ways to write calculations in Spotfire.
- In a transformation
- With a calculated column
- As a custom expression on the axis of a visualization
The first two options will always calculate on the ENTIRE data set. They will NOT account for filtering. The third option will account for filtering, but to write complex expressions, you must learn to use axis names.
Second, they are dynamic. By referencing the axis name in the expression rather than a column name, the column on the axis can change, and the expression will update accordingly. I’ll show an example below, which will also show syntax.
How do you write axis name syntax?
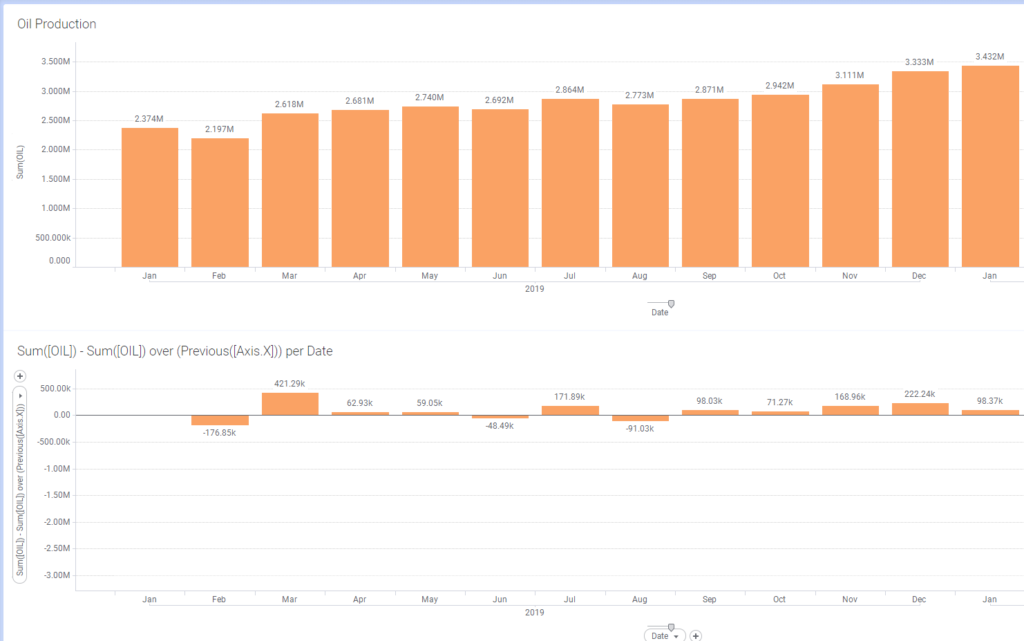
All axis names are referred to as [Axis.Axis Name], such as [Axis.Color] or [Axis.Columns]. For example, the expression below calculates the delta between the current month’s production and the previous month’s production.

Sum([OIL]) calculates the value for the “current” node or the current month. Then, it subtracts that value from the value of the previous node or previous month. Because the expression references Axis.X, I could change the x-axis to something else, such as a different date or a hierarchy and the expression would still work without modification.
Sum([OIL]) - Sum([OIL]) over (Previous([Axis.X]))Lastly, note that the axis name is wrapped in square brackets, just like column names.
Wrap Up
Okay, now you understand what axis names are. Are you ready to learn about them? In the coming weeks, I will post examples of how to use all the different axis names. Most of them I am very familiar with. Others will be a learning experience for me too. If you want to catch up on any of the other posts, the links are shown below.
Spotfire Version
Content created with Spotfire 10.3.
Posts in the Learning the Spotfire Expression Language Series
- Learning the Spotfire Expression Language
- Using the Over Keyword
- Node Navigation in Spotfire
- Using the Then Keyword
- Using the Intersect Keyword
- All, Next, Previous, AllNext, AllPrevious – Node Navigation
- First Node, Last Node, Last Periods, Previous Period, Next Period – Node Navigation
- Node Navigation – Parent & Parallel Period
- Node Navigation – NavigatePeriod
- $esc and $map functions

Pingback: Spotfire Axis Names on Bar Charts » The Analytics Corner
Pingback: Using Document Properties to Control Data Limiting by Expression » The Analytics Corner
Pingback: Spotfire Axis Names on Line Charts » The Analytics Corner
Pingback: How to Improve Spotfire Load Times » The Analytics Corner
Pingback: Limiting Data When Columns Change » The Analytics Corner
Pingback: Use IronPython to Navigate Spotfire Pages » The Analytics Corner
Pingback: How to Save Space in Spotfire Tooltips » The Analytics Corner
Pingback: The Danger of Hiding Data in Spotfire » The Analytics Corner